How to View the Average Provider’s Time Spent on Drafting Provider Note and Signing eSuperbill?
Follow the above workflow to land on the ‘Provider Efficiency’ page.
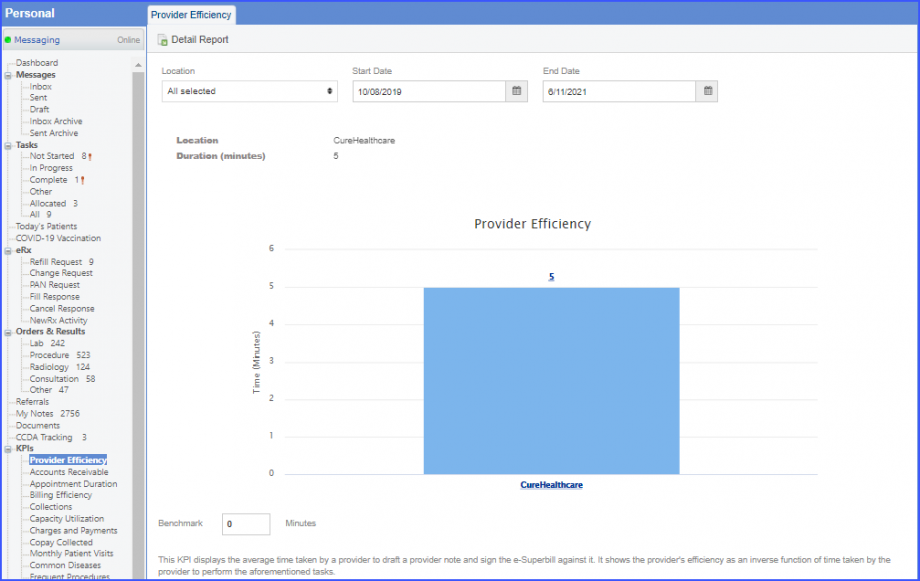
This KPI displays the average time a provider has spent on drafting a provider note and signing the eSuperbill against it.
This KPI can be filtered based on location, start and end dates.
When the user selects values from the search filters, the average provider’s time spent on drafting a provider note and signing eSuperbill against it is displayed for the providers in the selected locations.
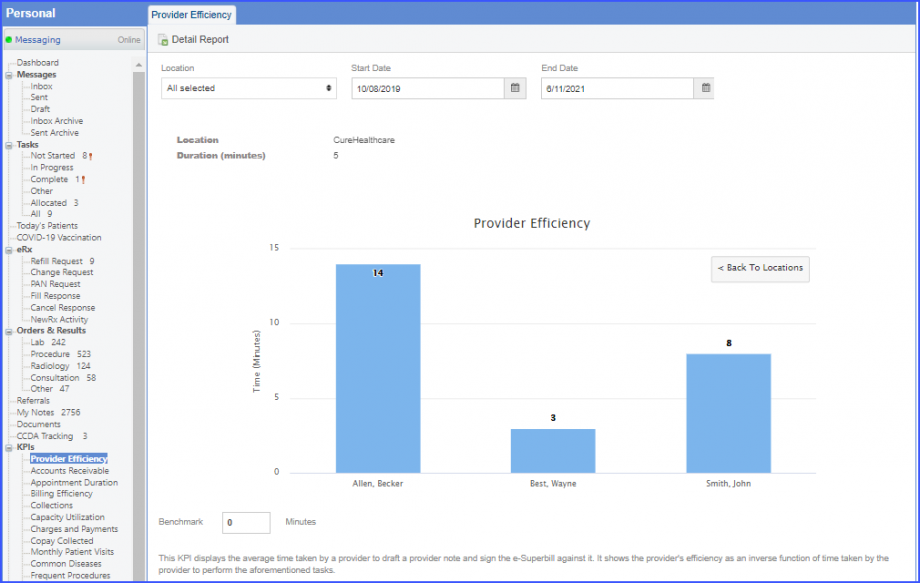
Users can click on a location’s bar on the graph to view the average appointment duration between the selected statuses for each provider.
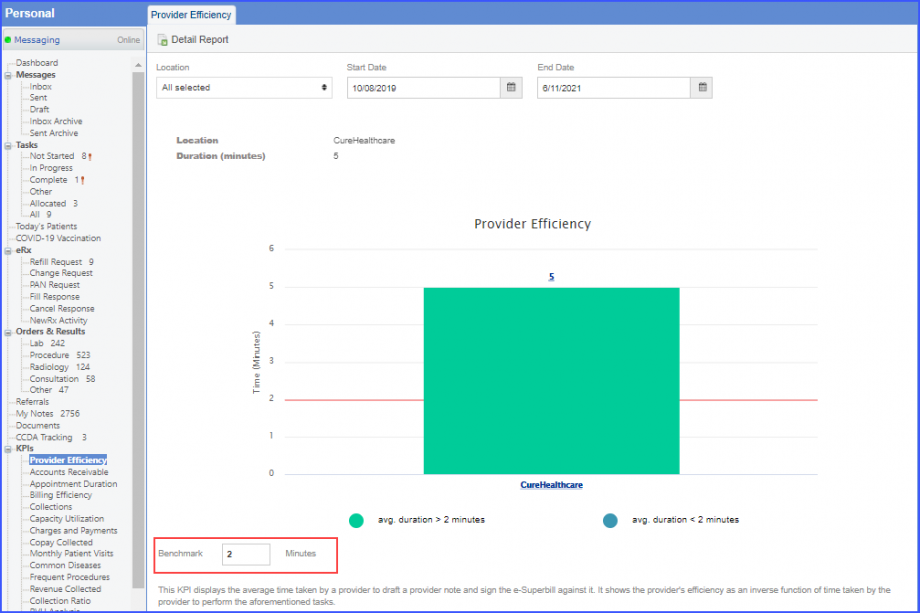
Additionally, a benchmark can be defined by entering a value in the highlighted field below:
Users can click ‘Detail Report’ button to download the report of the search results as an excel file. There is a separate sheet for each provider in the report and each sheet contains the information specific to each provider.

Users cannot access quality programs KPIs from the ‘KPIs’ bucket in the ‘Personal’ module.
The permissions to enable quality programs KPIs in the ‘Personal’ module have also been removed from the ‘Practice User’ and Role’ settings. To view the pages from which the permissions have been removed, click here for ‘Practice User’ settings and click here for the ‘Role’ settings.
Users can view the quality programs KPIs in the ‘Promoting Interoperability’ tab of the MIPS entities. In order to see how to access the ‘Promoting Interoperability’ tab, click here.
