How to Access Assessment Forms?
Users can fill these forms for a patient while the score is automatically calculated in the score field. These components cannot be accessed outside of compatibility view.
In order to see how to enable these forms for a user click here.
In order to see how to enable these forms for a specific role, click here.
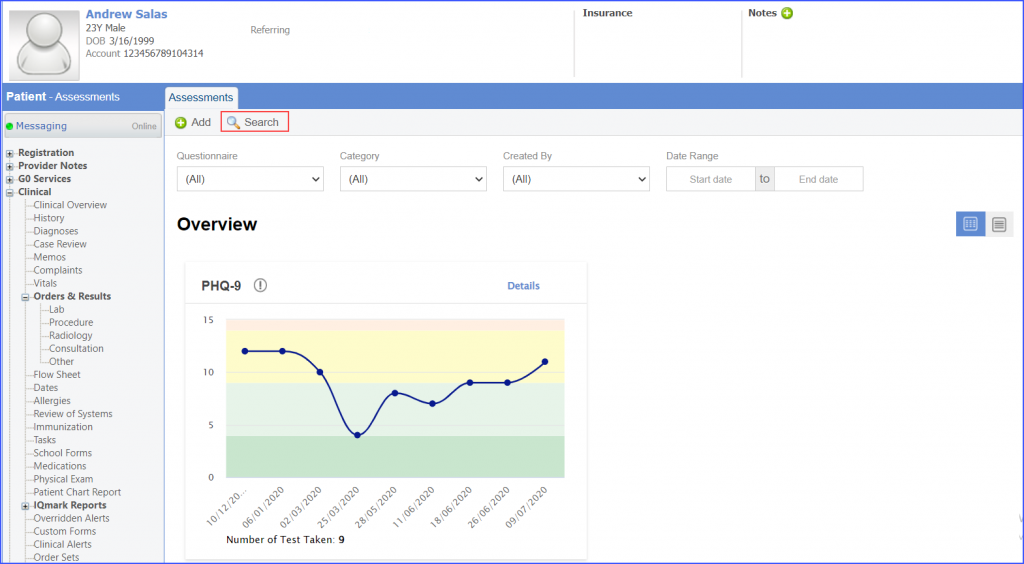
Follow the above workflow to land on the Assessments page. Users can filter the assessment forms based on:
- Questionnaire
- Category
- Created By
- Date Range
Once the search criteria has been entered, Click the ‘Search’ button.
The position of the Assessments component can also be adjusted in the left tree menu through the Clinical Module Sorting Preferences. Click here to see how.
Click ‘+ Add’ to see the listing page of the assessments forms.
The following assessment forms are displayed here:
- ACE
- EAT-26
- GAD-2
- GAD-7
- GDS
- MDQ
- MFQ
- ORT
- PC-PTSD-5
- PHQ-2
- PHQ-9
- PHQ-A
- RAPID3
- SCARED – Child Version
- SCARED – Parent Version
- SMFQ
- TICS
- YMRS
- ESS
- Y-BOCS
- EDS
- MMSE
- DES
- MMSE
- YMRS
- DEPS-R
- PAID
- Type 2 DDS
- AUDIT
- BEDS-7
- CAGE
- General DDS
- Type 1 DDS
- AIMS
- Reflux System Index (RSI)

- Tinetti
- Berg
- Dynamic Gait Index
- Falls Efficacy Scale
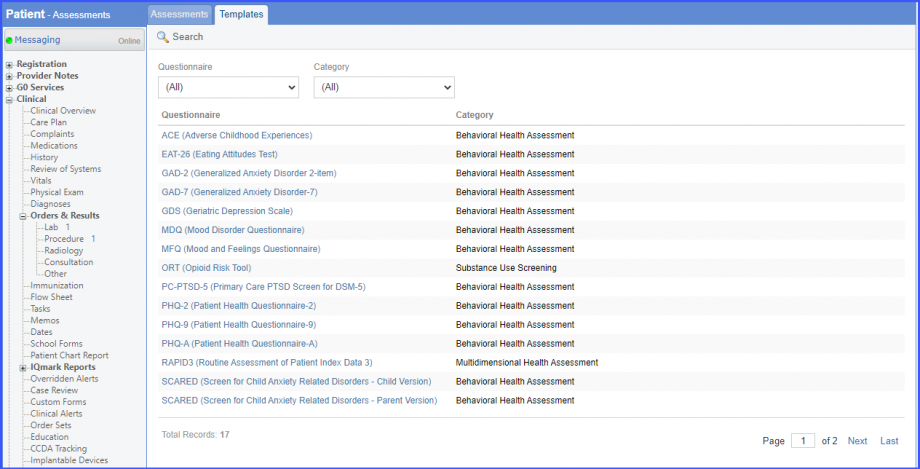
Users can select an assessment form by clicking its hyperlink. Once user selects options for the mandatory fields, the score is automatically calculated and displayed in the ‘Score’ field.
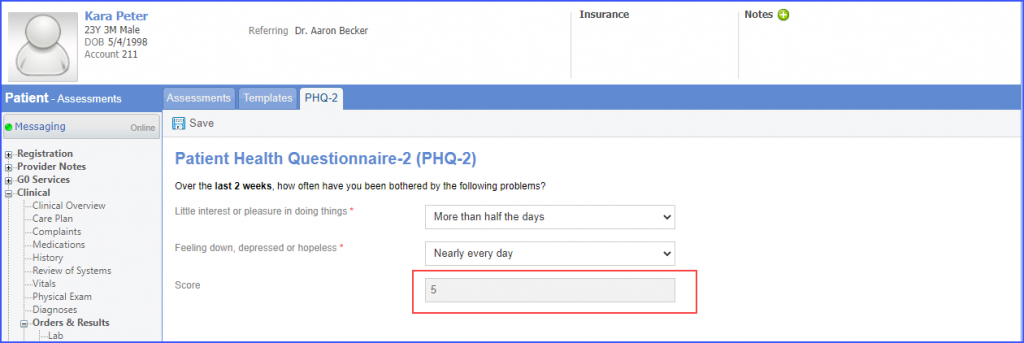
Users can click on ‘Save’ to save the form.

Submitted forms are displayed in the ‘Assessments’ tab as shown below.

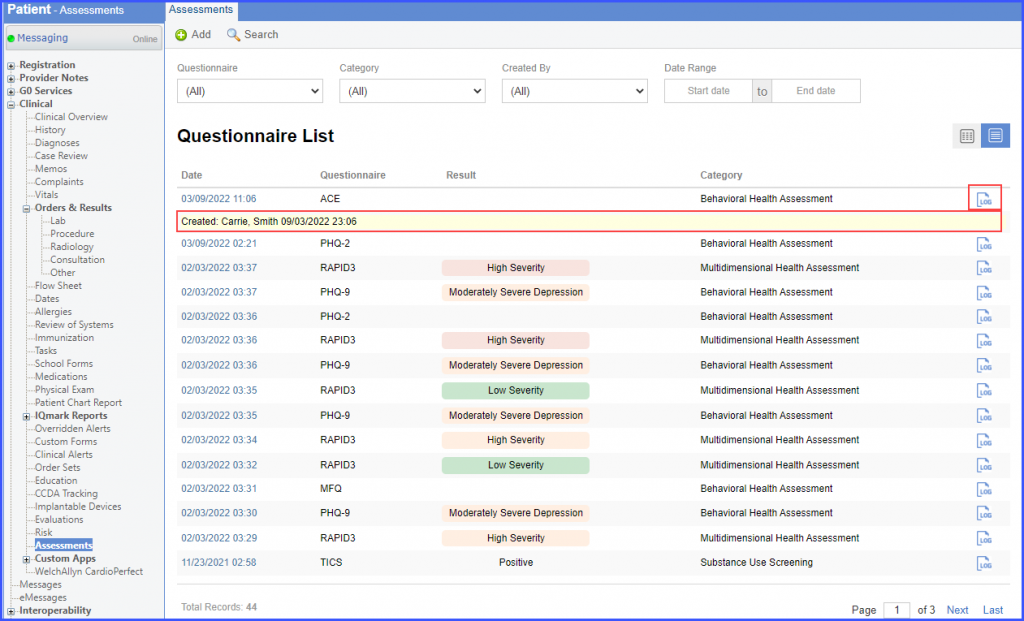
Previous user activity can be viewed by clicking the log icon next to an assessment form in the ‘Log’ column.

Similar enhancement has been made in the ‘Provider Notes’ section. To view the change, click here.
A comment section has been added to assessment forms.
Users can add their comments in the ‘Comments’ textbox.
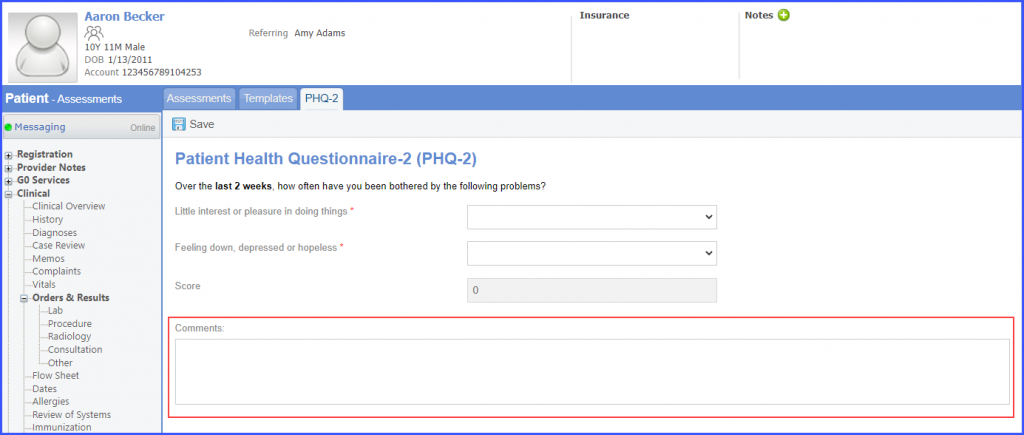
When the score for a PHQ-2 form is equal to or greater than 3, the system notifies the user to evaluate the patient using PHQ-9 form.
Select the mandatory criteria for a PhQ-2 form and then click ‘Save’.
A pop-up is displayed with the following message:
‘A major depressive disorder is likely if the PHQ-2 score is 3 or greater. Further evaluation is recommended to evaluate the patient with PHQ-9. Do you wish to proceed to the PHQ-9 for?’

If the user clicks ‘Yes’, he/she is directed to the PHQ-9 form.
Users can view patient’s assessments in graphical form.
This allows users to analyze patient’s information in graphical form in addition to descriptive form.
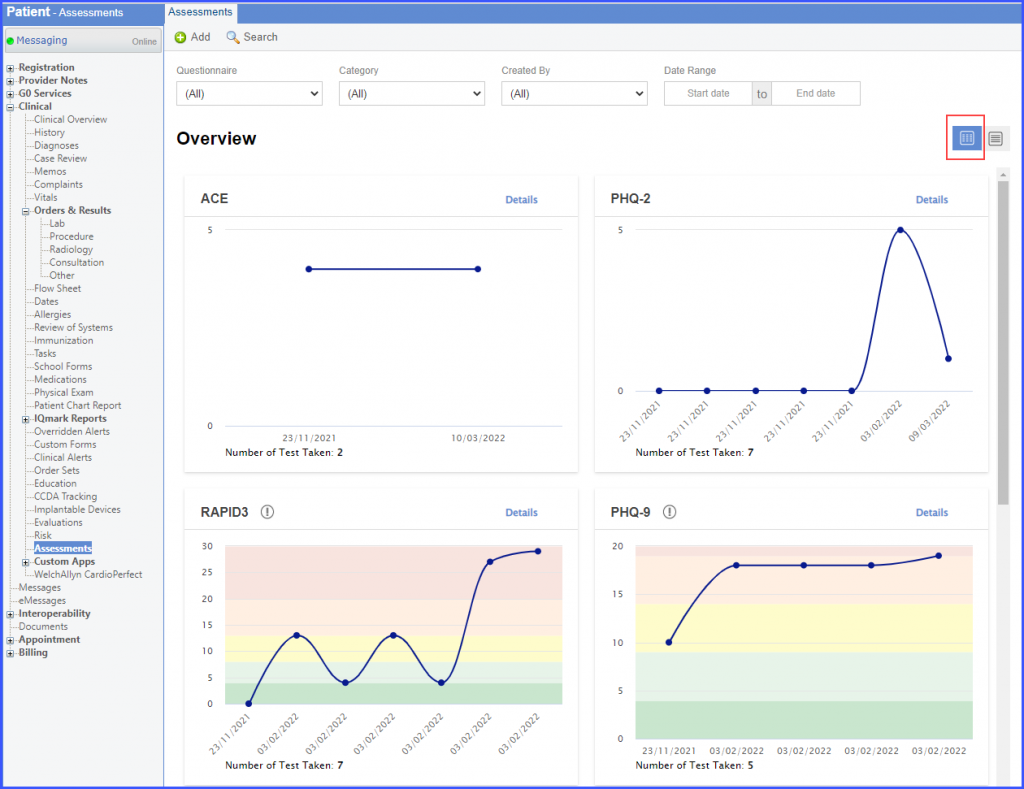
When the user navigates to ‘Assessments’, the system displays ‘Overview’ section as default. Additionally, following icons appear on the screen:
- Overview section
- Listview section
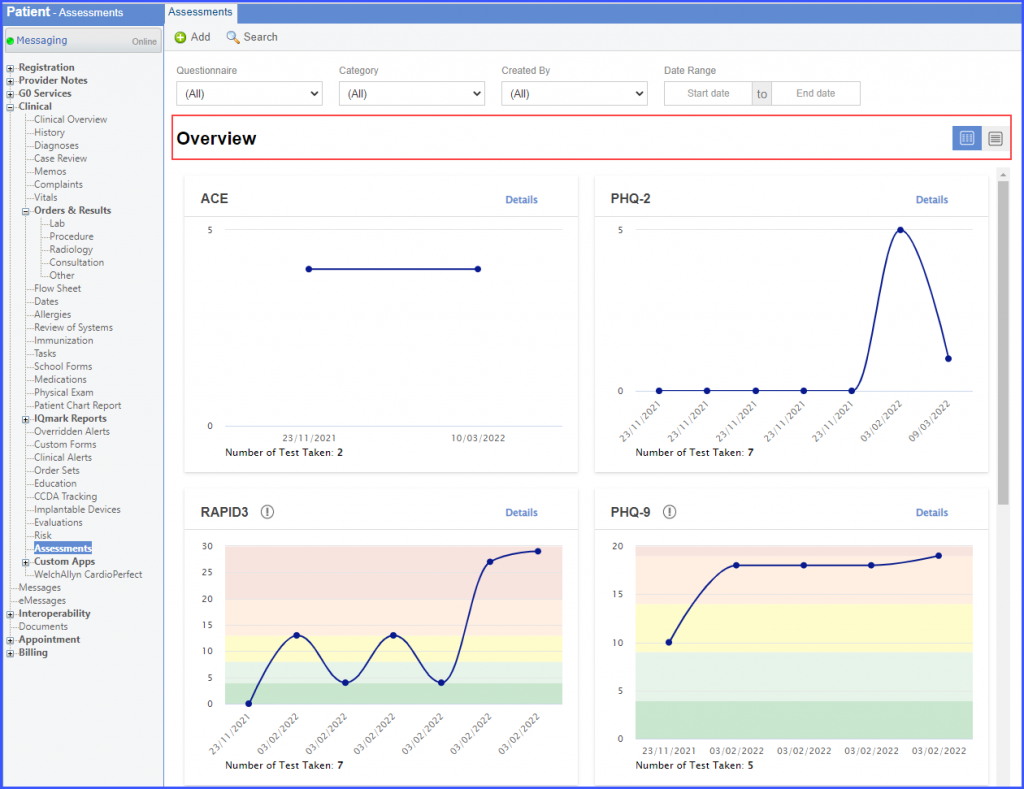
Clicking on ‘Overview’ icon displays graphical representation of the questionnaires filled for the patient.
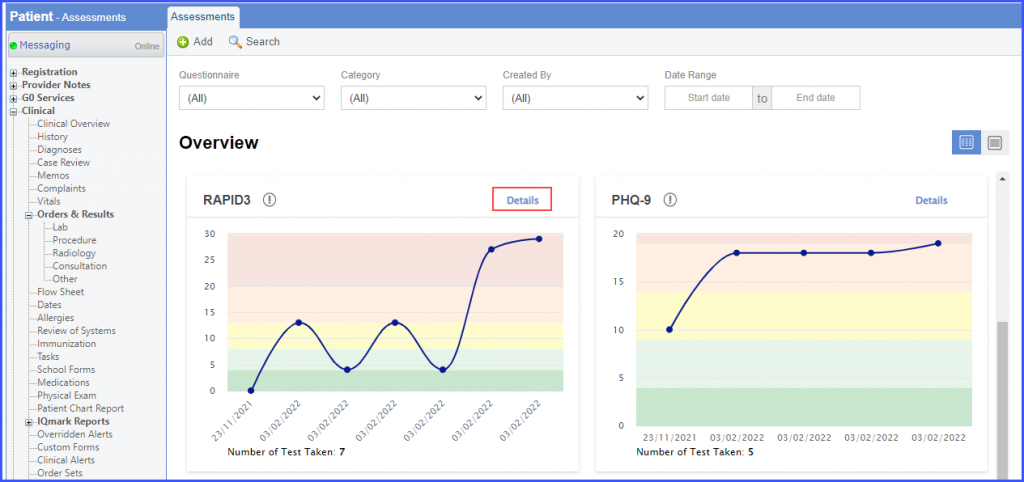
Assessment Graphs are color-coded based on the score interpretations and populate in a card format into two columns.
Each graph has a ‘Details’ hyperlink on the top right corner.
System displays a line graph with data markers with scores populating on the y-axes & encountering dates on the x-axes.
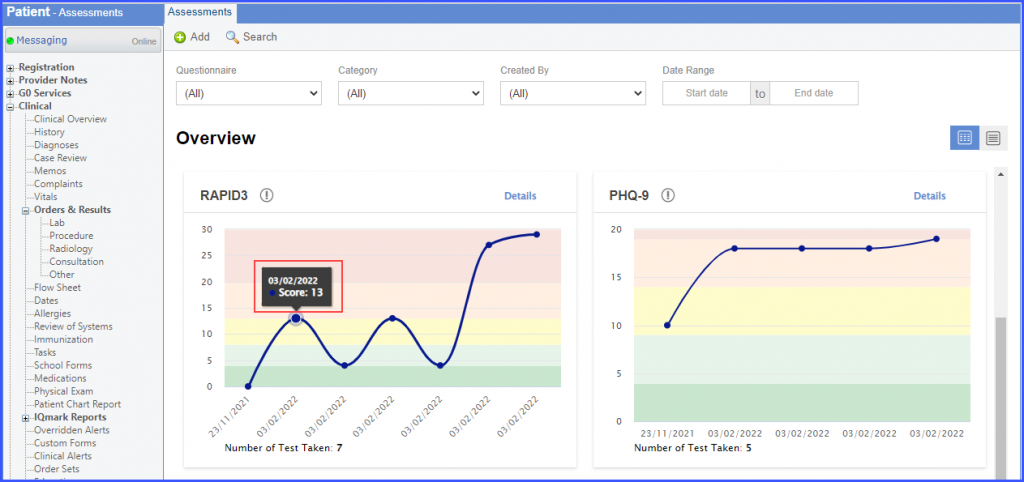
Scrolling over the horizontal axis presents scores on the desired encounter date.
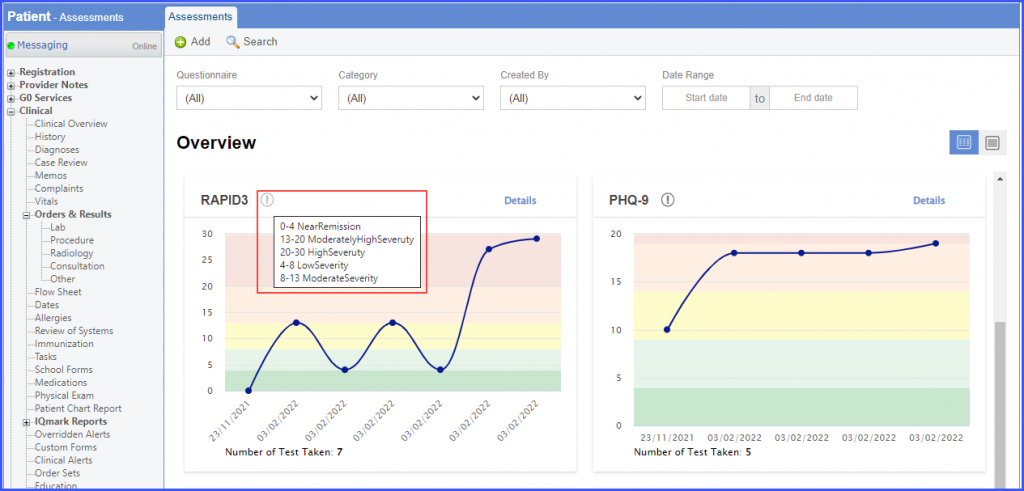
The graph presents the following information:
- Assessment Title
- Information Icon
- Score on the y-axis
- Date filled on the x-axis
- Count of Number of Test Taken
Hovering over the ‘Information’ icon displays interpretation of scores in the tooltip.
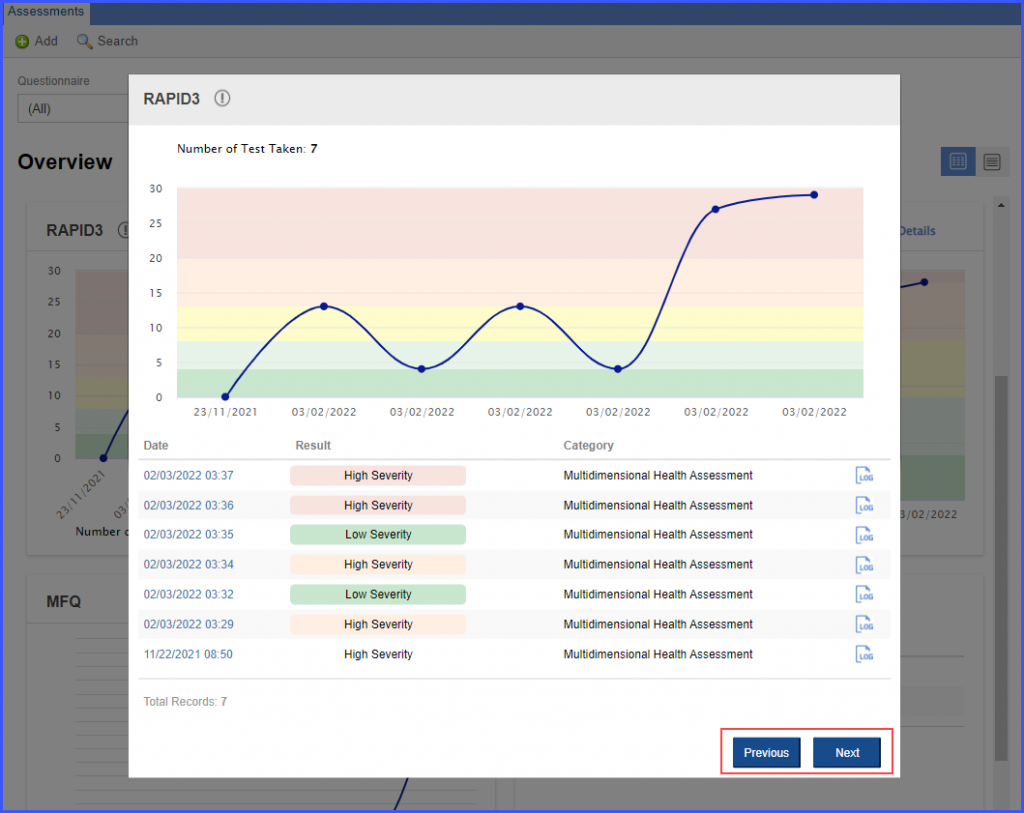
Clicking on ‘Details’ link displays a pop up containing graphical view of the selected questionnaire filled by the patient along with the list of all filled questionnaires.
Dates appear as hyperlinks, clicking on them opens the respective questionnaire.
‘Details’ prompt window displays ‘Previous’ and ‘Next’ buttons on the bottom-right corner.
Hovering over the graph point displays a ‘Tooltip’ containing the ‘Date’ and ‘Questionnaire Score’.
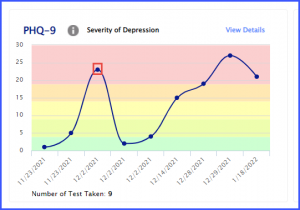
Clicking on ‘Graph Point’ opens the respective assessment forms.
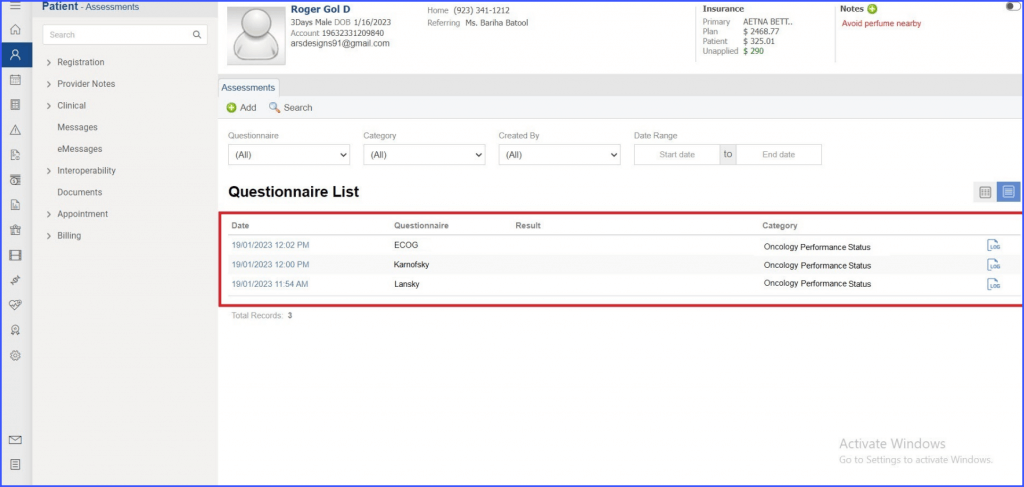
Clicking on ‘Listview’ icon displays a list of assessments filled by the patient as ‘Questionnaire List’.
‘Questionnaire List’ displays the following information:
- Date and time on which a questionnaire is filled.
- Questionnaire Name
- Results of filled questionnaire which are color coded based on the score interpretation.
- Category of the form
- Logs Icon for record of changes made to the questionnaire
Dates appear as hyperlinks, clicking on it opens up the respective questionnaire.
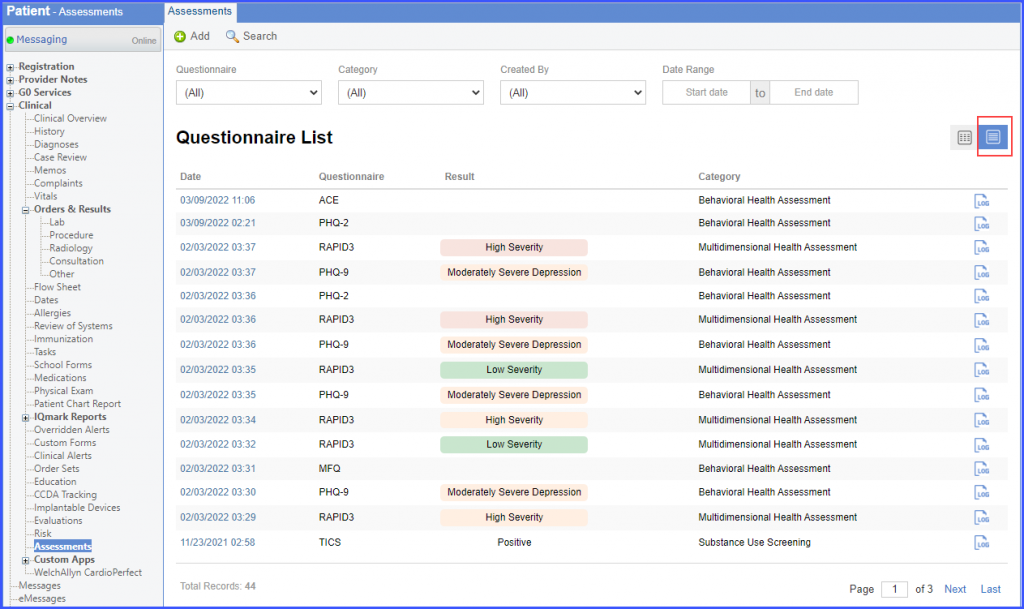
Clicking on ‘Log’ button opens up the ‘Logs’ section displaying the creator name along with date and time.
To view the Assessments component on the Provider Note, click here.
Users can evaluate and record the performance of oncology patients directly from 10g application.
- ECOG (Eastern Cooperative Oncology Group)
- Karnofsky
- Lansky
