What is the Purpose of Growth Charts?
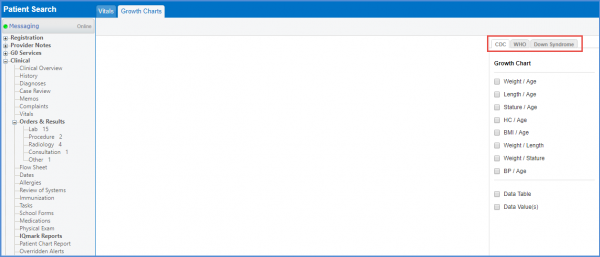
Follow the workflow above to land on the Growth Charts screen.
Growth charts are used by pediatricians and other healthcare providers to monitor a child’s growth over a certain period of time. The standards are constructed by studying samples of large numbers of children over certain periods of time.
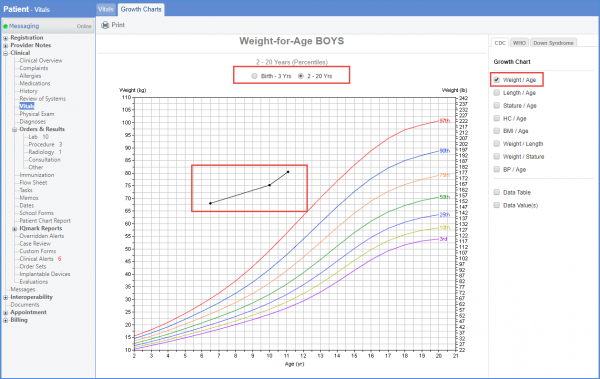
Growth charts consist of a series of percentile curves that illustrate the distribution of selected body measurements in children. Pediatric growth charts have been used by pediatricians, nurses and parents to track the growth of infants, children, and adolescents.
The users can view Growth Charts in both ‘Metric’ and ‘English’ units i.e. Centimeters and Inches. The units can be seen on both sides of the “y axis”.

There are different standards to monitor growth according to a child’s age. It is recommended that health care providers use ‘WHO’ growth standards to monitor growth for infants and children aged 0 to 2 years of age. Use ‘CDC’ growth charts for children aged 2 years and older.
In the CureMD application, there’s an additional tab of ‘Down Syndrome’ that gives map trends in the vitals of Down Syndrome patients.
Once the standards are selected, users need to select the type of growth chart and set the age range. Patient vitals are mapped as points on the graph.

