How to View the Average Time Between Check-In and Check-out of a Patient?
Navigate to the above workflow to land on the ‘Appointment Duration’ page. ![]()
Users can track the duration between the selected Appointment Statuses.
This makes it easier for users to monitor the appointment processes and provide an efficient patient experience.
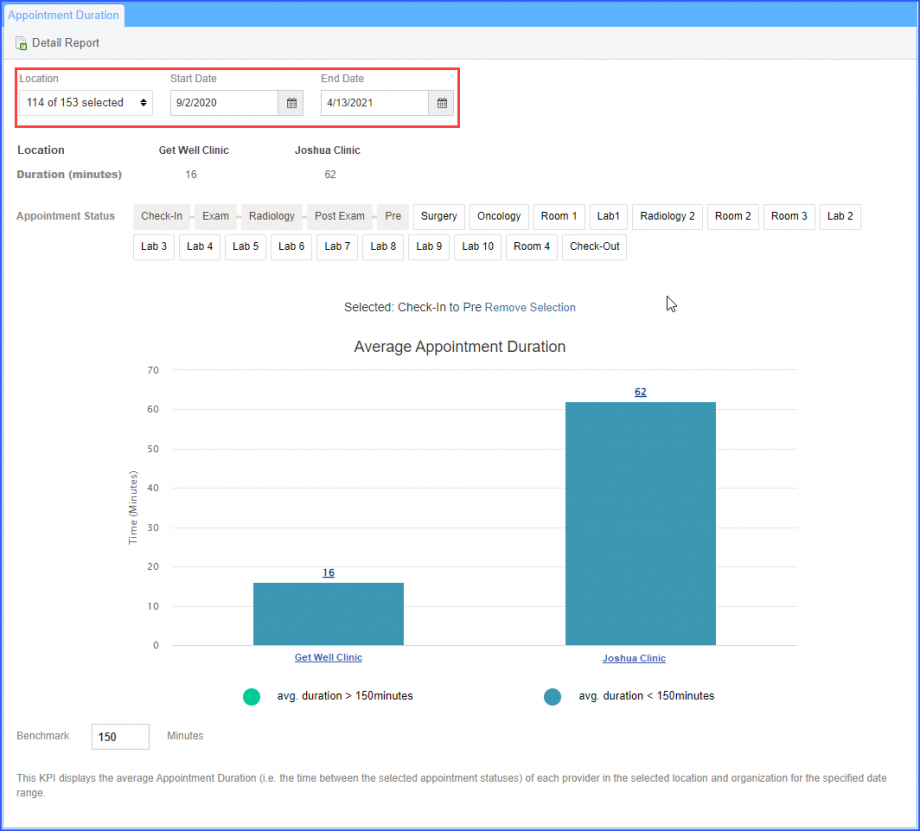
The results can be filtered by Location, start and end Dates.
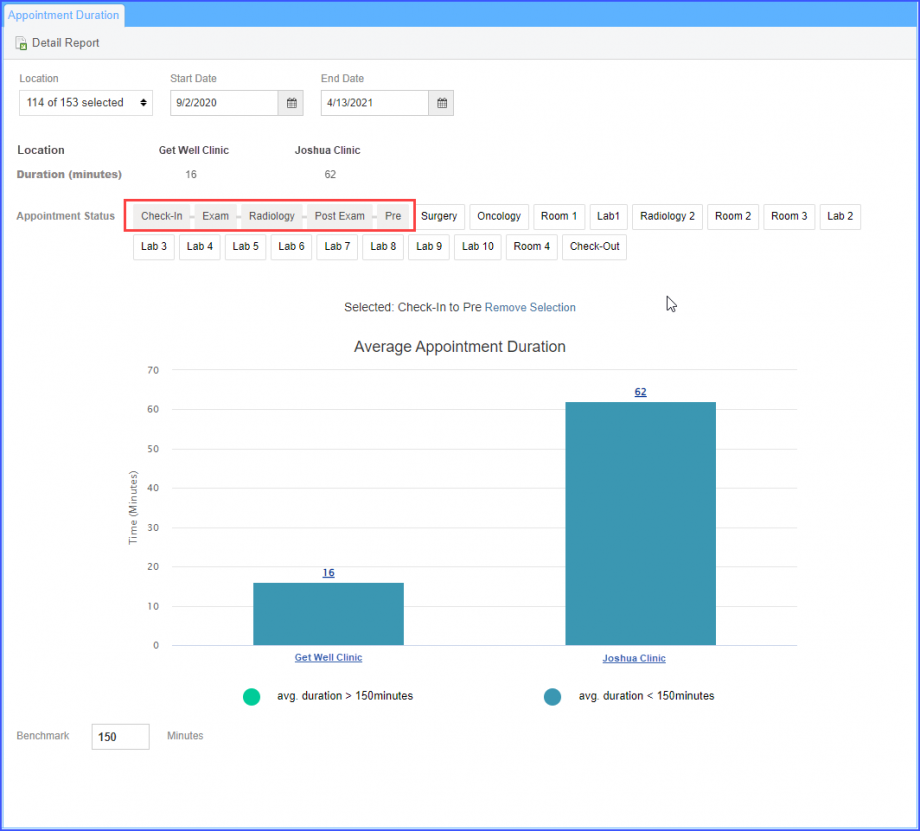
User selects the starting appointment status from when they want to determine the time taken.

Once the starting appointment status is selected, the user selects the ending appointment status to determine the total time taken in between the two selected statuses.
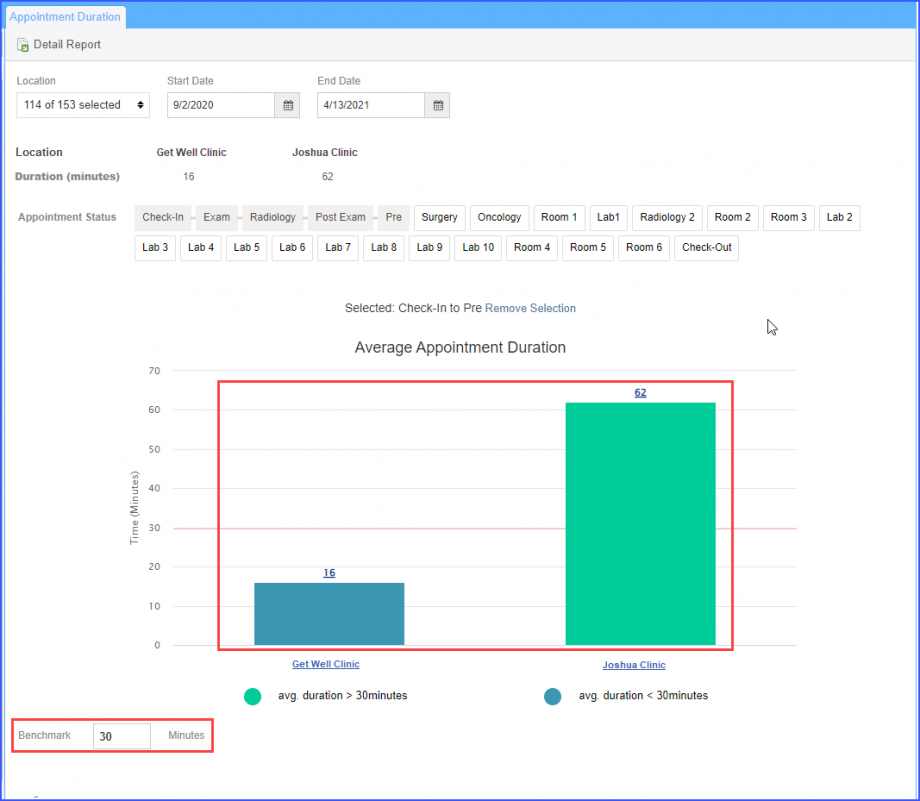
Selecting the appointment statuses displays a graphical representation of the average appointment duration for all appointment statuses occurring between the starting and ending appointment statuses.
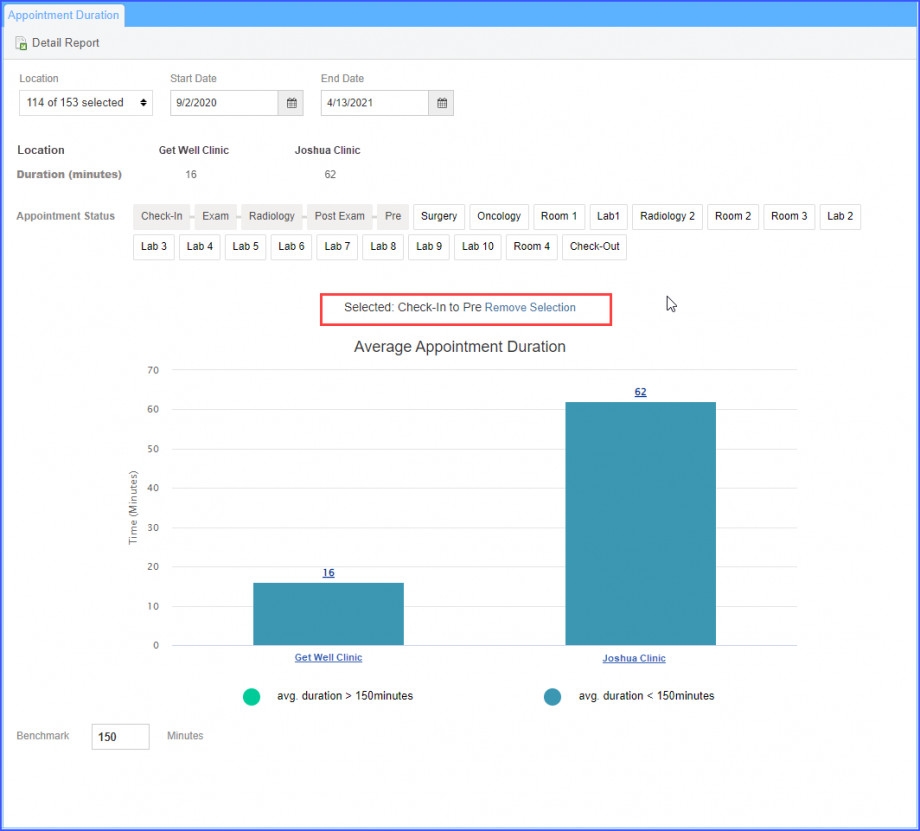
A message is displayed under the appointment statuses which mentions the starting and ending status.
User can click on the ‘Remove Selection‘ hyperlink to cancel the status selection.
The results continue to vary based on the continued selection made by the users.
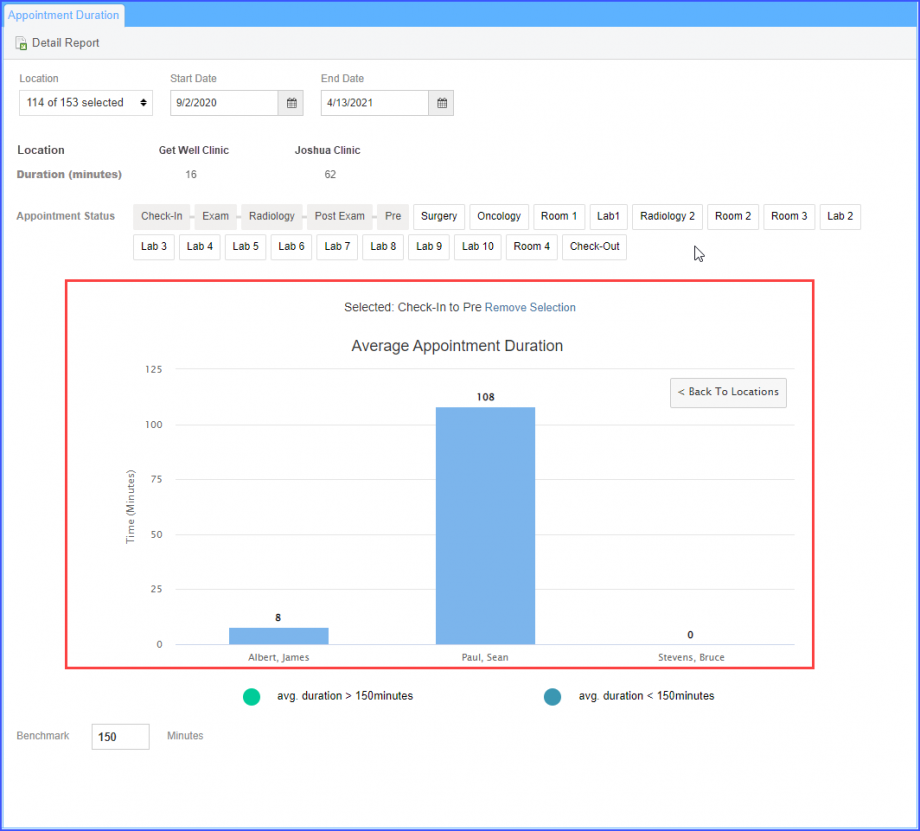
The user can click on the graphs to view further details for the relevant area.
Clicking on the relevant graph displays the average appointment duration from a Location level to the Providers-specific levels.
Click on the ‘Back to Location’ button to move back to the previous location level.
Users can add a Benchmark value to mark the duration as greater or lesser, compared to the entered value.
The graph with a duration value greater than the entered benchmark value is highlighted in green color; whereas the graph with a duration value lower than the benchmark value is highlighted in blue.
The entered value is marked as a flat red line on the graph.
Click on the ‘Detail Report’ to download the print of the ‘Average Appointment Duration’ for the practice location.

