What is the Purpose of Different Tabs in Growth Charts?
Follow the workflow above to land on the Growth Charts tab. On the right side, there are 3 tabs with different standards of measurement.
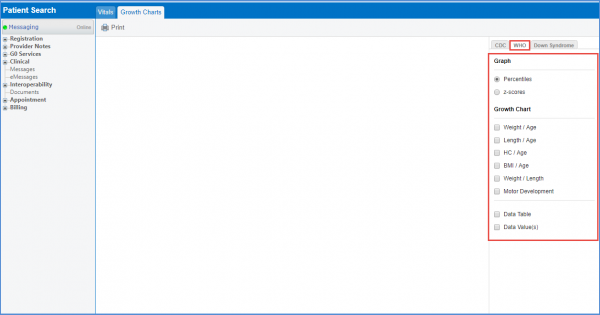
The WHO Standards are recommended for children between ages 0 to 2. It contains various combinations of vitals after frequent intervals. This is done to get a detailed and specific record of growth for children.
Users can choose whether they want to view graphs in percentiles or z-scores.
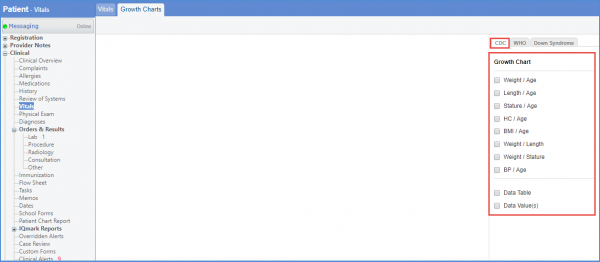
The CDC Standards are recommended for children above the age of 2.
The Down Syndrome tab has trends mapped specially for the patients with Down Syndrome.
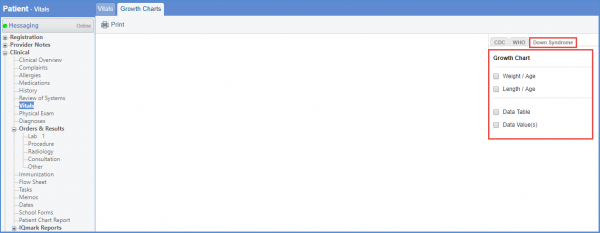
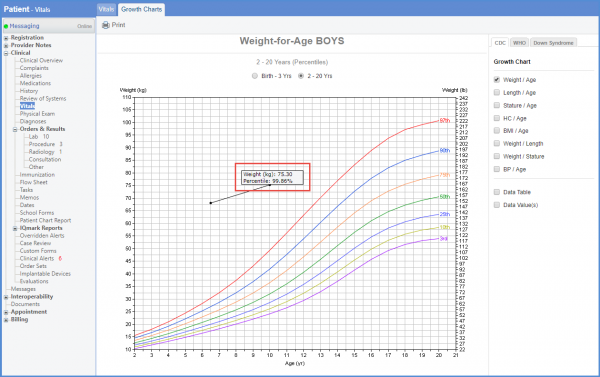
To notice the trend of a vital against the other, mark the checkbox (of one or more) and then the age range.
The graph lines mark different percentiles and the age range is auto-selected by the system based on the age of the patient.
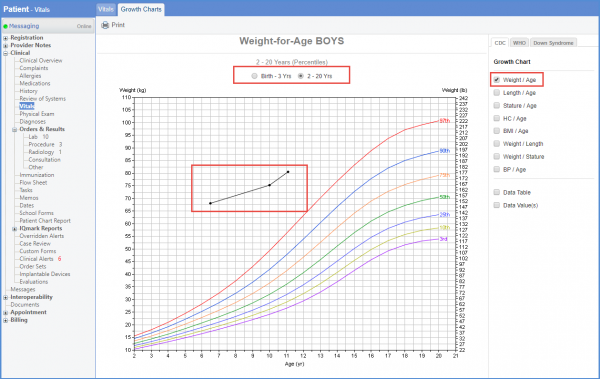
Every valid percentile value on the graph displays a tool-tip upon mouse hover. This tooltip contains accurate value of the graph and the percentile along y-axis.