What is the Face Sheet Component in the Treatment Plan?
The factsheet consists of the patient’s current ‘Complaints’, ‘Vitals’, ‘Medications’, ‘Lab Results’, and ‘Radiology Results’. Users can access this component by clicking on the drawer tab ‘![]() ’ on the top of the screen. The user can scroll horizontally using the scroll buttons.
’ on the top of the screen. The user can scroll horizontally using the scroll buttons.
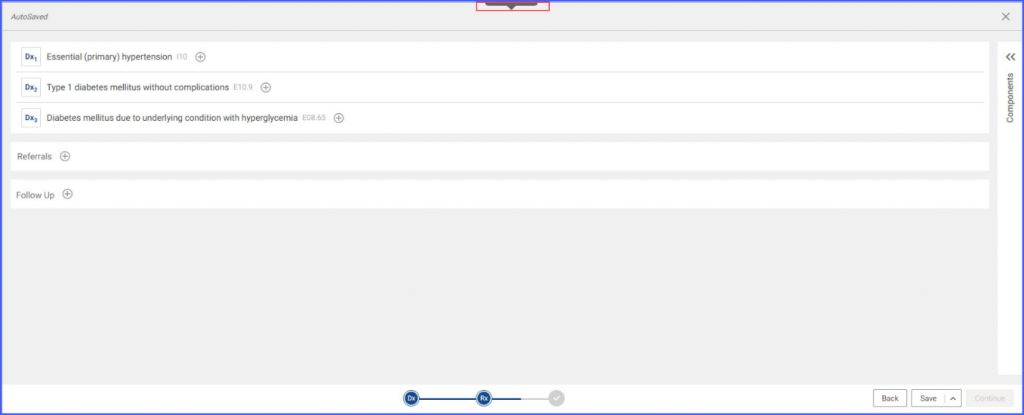
Once the expand icon ‘ ![]() ‘ is clicked, the face sheet is displayed. The face sheet helps users access important patient health information as and when needed, while devising a treatment plan for a patient.
‘ is clicked, the face sheet is displayed. The face sheet helps users access important patient health information as and when needed, while devising a treatment plan for a patient.
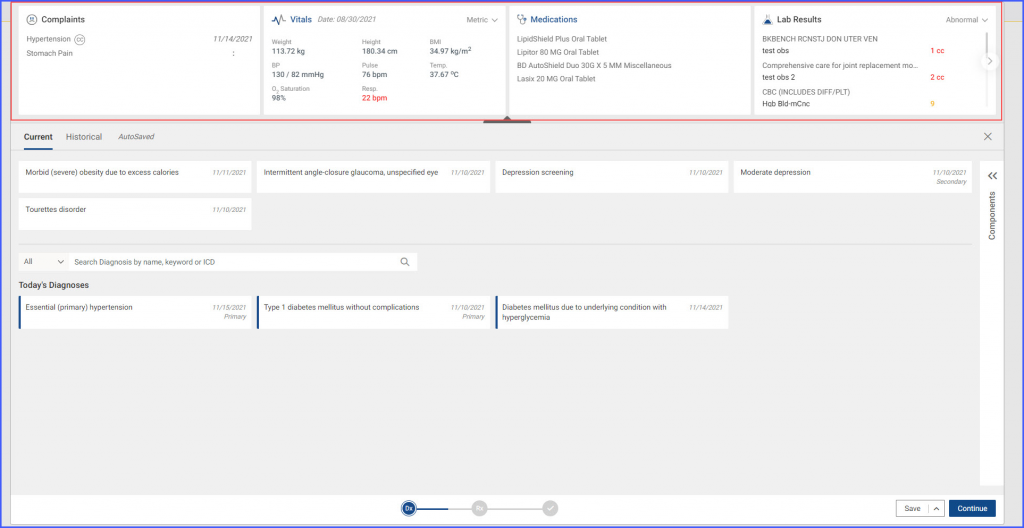
The ‘Complaints’ section on the face sheet displays patient’s complaints recorded for the current encounter. The chief complaints are indicated by the icon ‘![]() ’.
’.
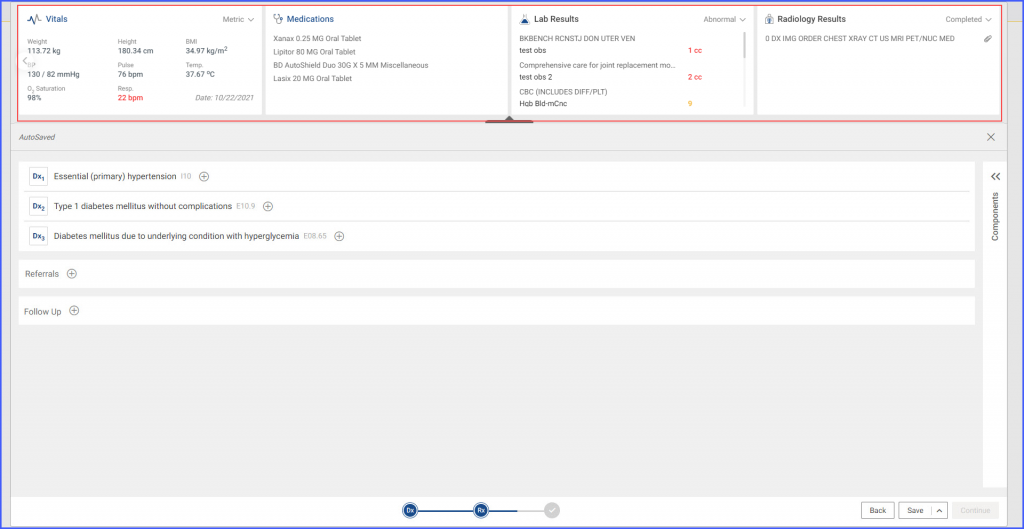
Users can view the vitals of the patient in the ‘Vitals’ section. The recording date is present next to the tab name.
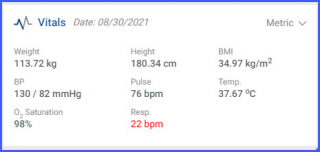
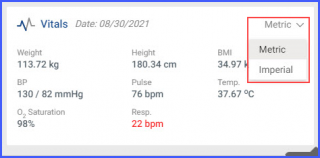
Vitals can be viewed in ‘Metric’ or ‘Imperial’ unit system by choosing either ‘Metric’ or ‘Imperial’ from the dropdown on the top right of the tile.
Clicking on the tab name expands the tile in a pop-up to view a history of patient’s vitals in tabular form. A dropdown is present on the top left to view the vitals’ values in either ‘metric’ or the ‘imperial’ format.
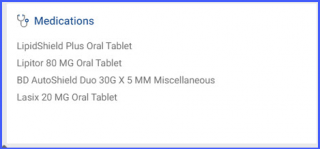
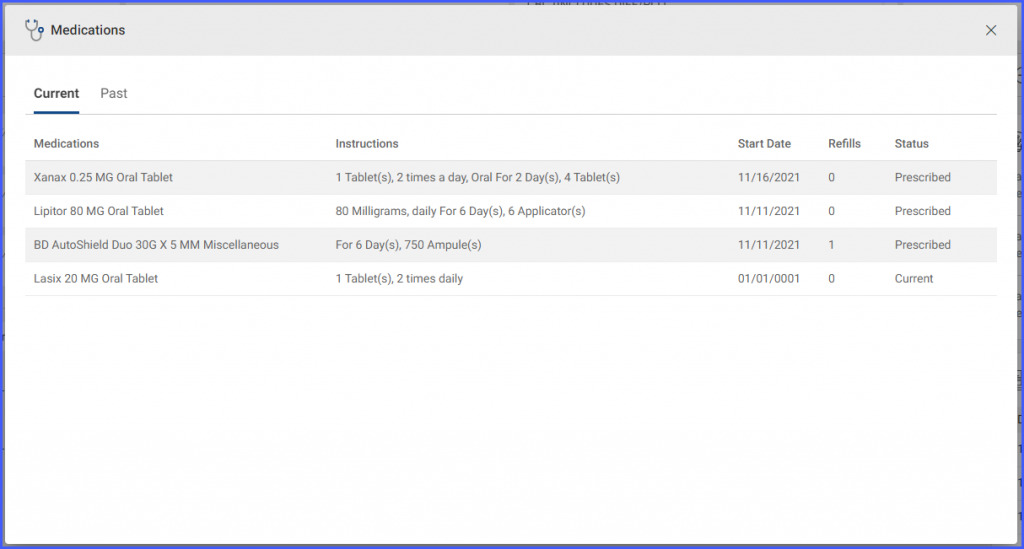
In the ‘Medications’ tile on the face sheet, users can get an overview of the patient’s current medications.
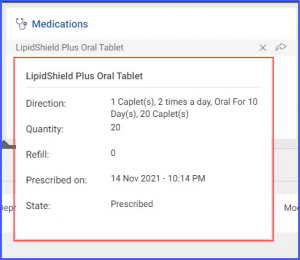
Hovering over a medication displays a tooltip with the following information:
- Directions
- Quantity
- Refills
- Prescribed date
- State
Users can expand the ‘Medications’ tile by clicking on the tile heading to view all the current and past medications of the patient in tabular form. Current and past medications can be viewed by opening the ‘Current’ and ‘Past’ tabs respectively.
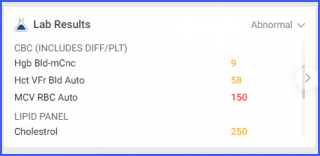
The abnormal and pending lab test results of the patient are displayed in the ‘Lab Results’ tile of the face sheet. By default, abnormal lab results are shown if present.
In order to view the pending lab results of the patient, the user can choose ‘Pending’ from the top right dropdown. The tile now enlists all lab orders of the patient against which the results are still pending.
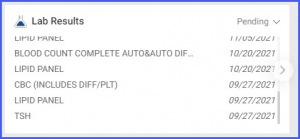
The pending lab results are displayed in reverse chronological order. The lab results record is shown up to the last six months here.
The ‘Radiology Results’ face sheet tile contains the patient’s complete and pending radiology results. The user can switch between the two lists using the top right dropdown. The ‘Completed’ radiology results contain a list of the patient’s results for the ordered radiology test.
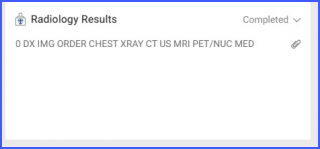
The ‘attachment’ icon next to the test name indicates the presence of an attachment. Clicking on the ‘attachment’ icon opens the list of attachments associated with the radiology result in a dropdown.
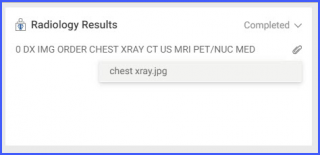
Clicking on a file name opens the radiology result in a pop-up.
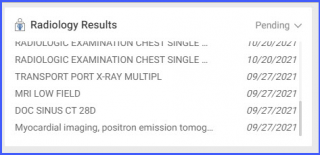
Similar to the ‘Lab Results’ tile, the pending ‘Radiology Results’ can be accessed by choosing ‘Pending’ in the top right dropdown. The displayed list now contains the radiology orders with pending results.
The listing for radiology results can be accessed via the Face Sheet Component of the Treatment Plan.![]()
This allows the user to review acknowledged and unacknowledged radiology results.
Click on the ‘Radiology Results’ hyperlink to access the radiology results’ listing window.
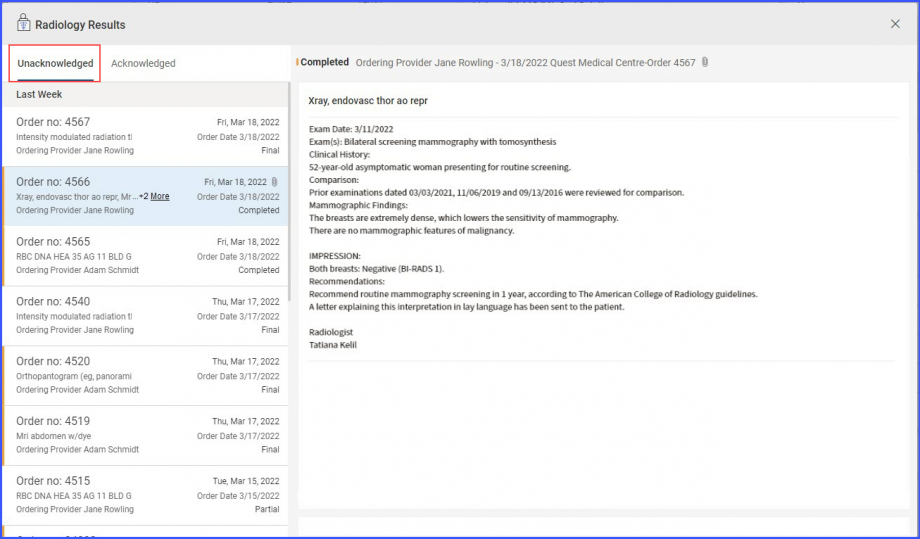
The following items are displayed on each result tile:
- Order Number
- The list of ordered radiology tests
- Name of the ordering provider
- Order date
- Status of the order
If there are no received results listed in the ‘Unacknowledged’ tab, the system displays a text stating:
‘No Radiology Results found! Switch to the [Acknowledged tab]’.
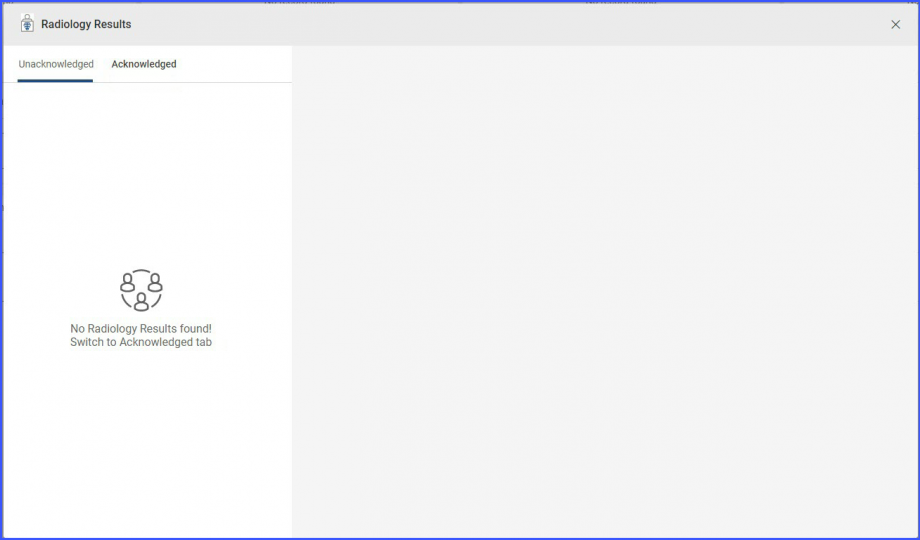
Similar, text appears in the ‘Acknowledged’ tab if there are results found.
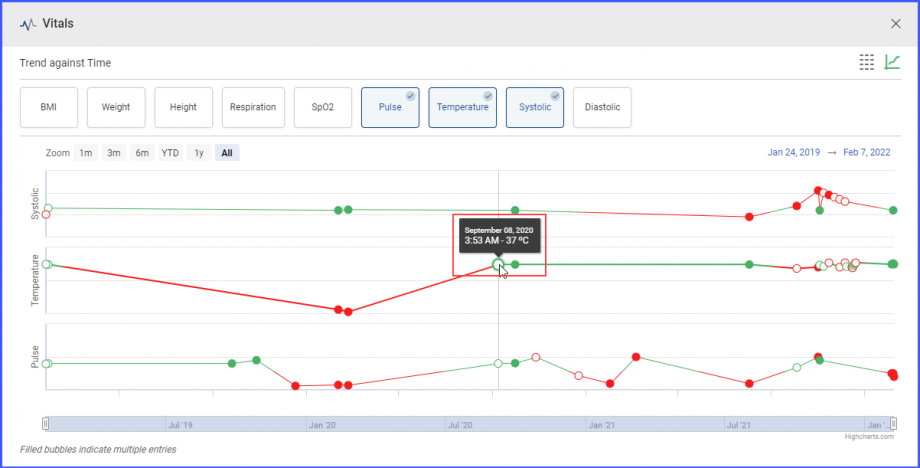
Users can view the trends of patient’s vitals.
This allows users to incorporate patient’s vitals information while devising a treatment plan.
System displays a ‘Graph View’ icon next to ‘Table View’ icon. However, Table View opens as default.
Clicking the on ‘Graph View’ icon displays the graph of patient’s vitals. Moreover, when multiple parameters are selected, they are stacked above one another.
Green colored graph lines indicates normal reading. Meanwhile, red color indicates abnormal/critical readings.
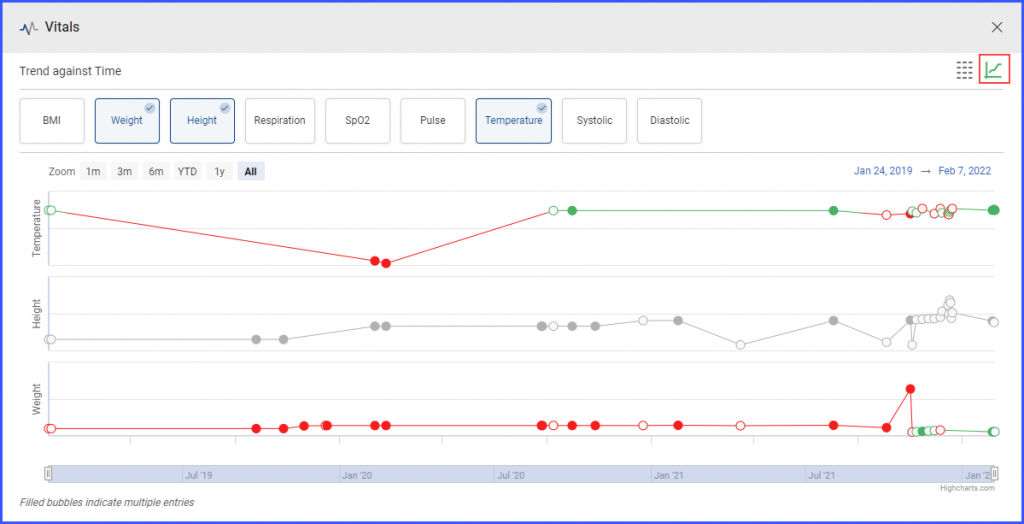
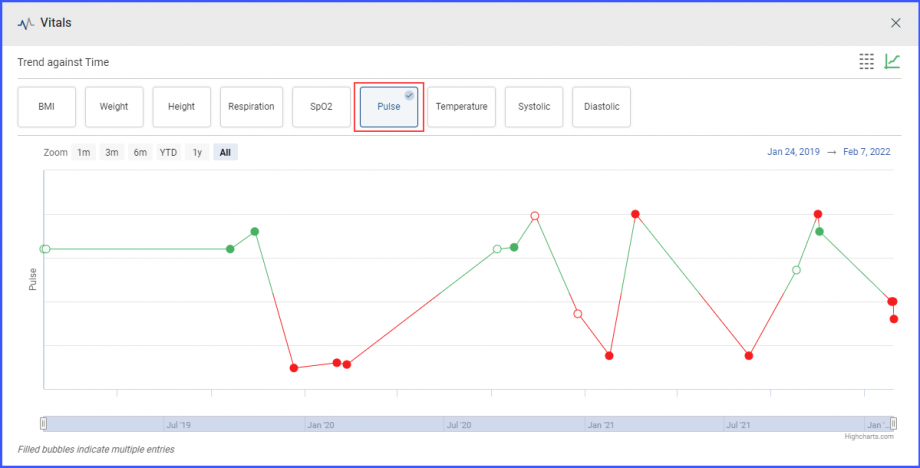
Clicking on a parameter displays a graph plotted according to recorded readings.
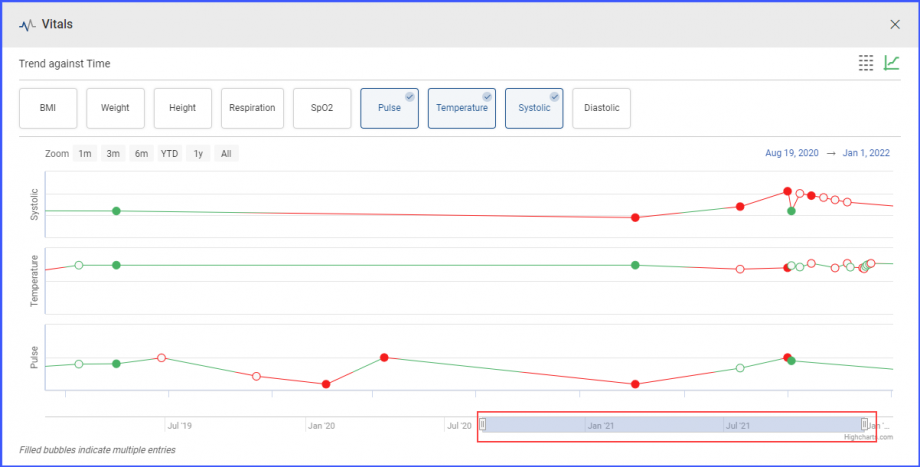
Users can expand or reduce the ‘Time Axis’ bar to change time period of the graph readings. Moreover, ‘Time Axis’ bar can be moved to the right or left as per requirements.
Hovering over the filled data marker, system displays a ‘Tooltip’ with date and multiple recorded readings at various times.
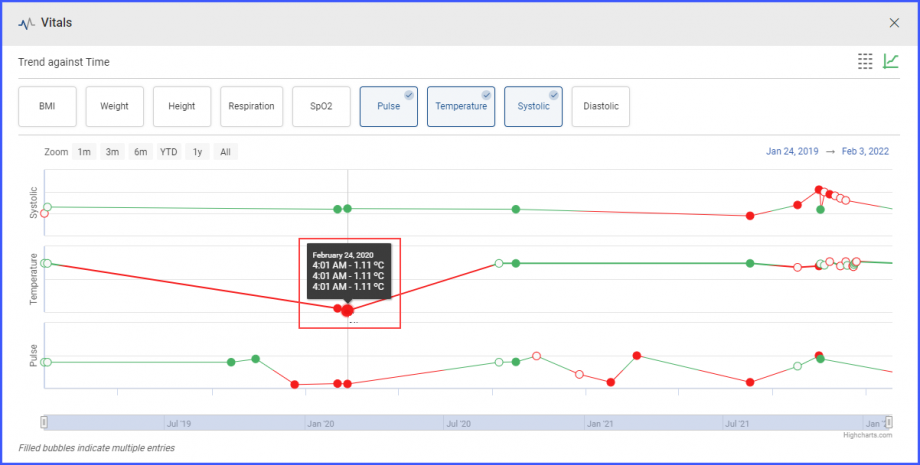
However, when users hover over empty data marker, system displays a ‘Tooltip’ with date and a recorded reading at that time.
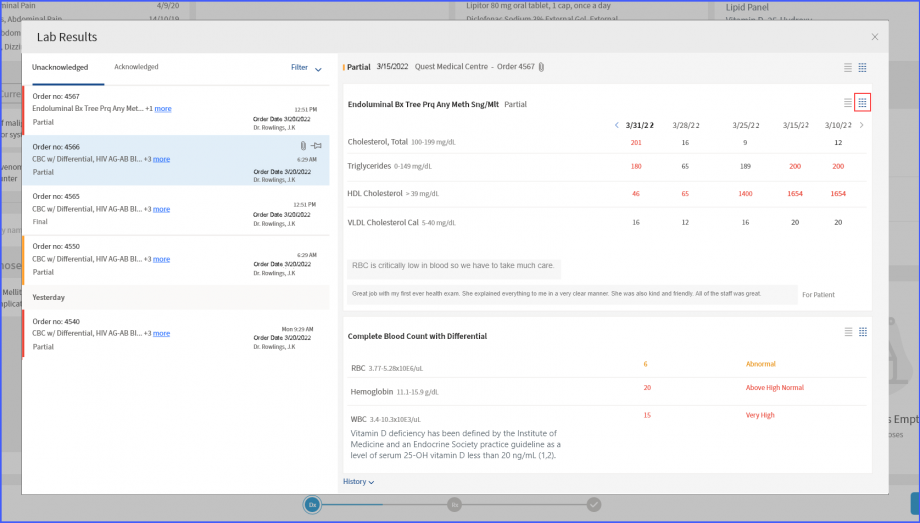
Lab results in treatment plan can be viewed in flowsheet view.
This allows users to effectively track the progress of patient’s health.
The user expands the ‘Lab Results’ tile by clicking on the tile heading to view all the acknowledged and unacknowledged lab results. When the user clicks on a lab result in the lab result listing, the system displays the lab result in the right pane in report view.
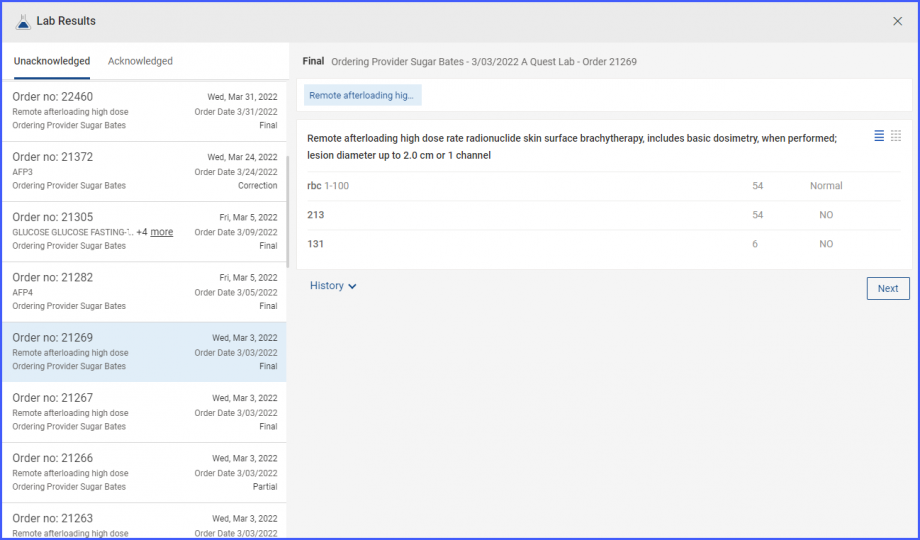
To view the lab result in flowsheet view, click on the flowsheet icon.