Charts
With IZENDA, user can portray the report in the form of chart or graph. A chart can be created using the data in the table/view selected on the Data Sources tab. User can have multiple charts in one report or put multiple charts of summary information on a dashboard to show key business metrics.
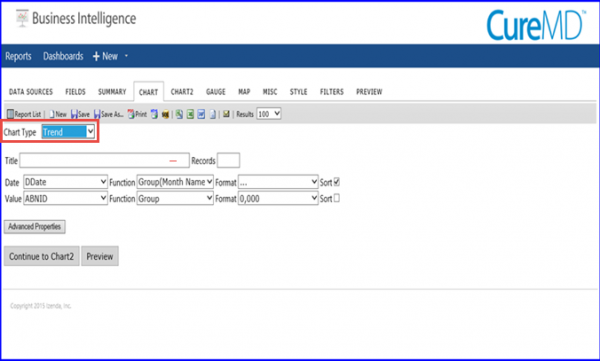
There are different type of charts user can create from this tab.
- Trend
- Pie
- Plot
- Bar
- Funnel
- Visualization Charts