CureConnect Portal
Description
The ‘CureConnect’ Portal provides insights into your billing data and Key Performance Indicators at every level of the billing cycle.
At $25 per month, our services include:
- KPI Dashboards
- Solutions & Reports
- Claim management
- Trends analysis
Activation Method:
Service activation can be requested by logging a support ticket.
Deactivation Mechanism
Service can be deactivated by logging a Support ticket or contacting the support helpline.
Application UI:
CureConnect Portal Dashboard:
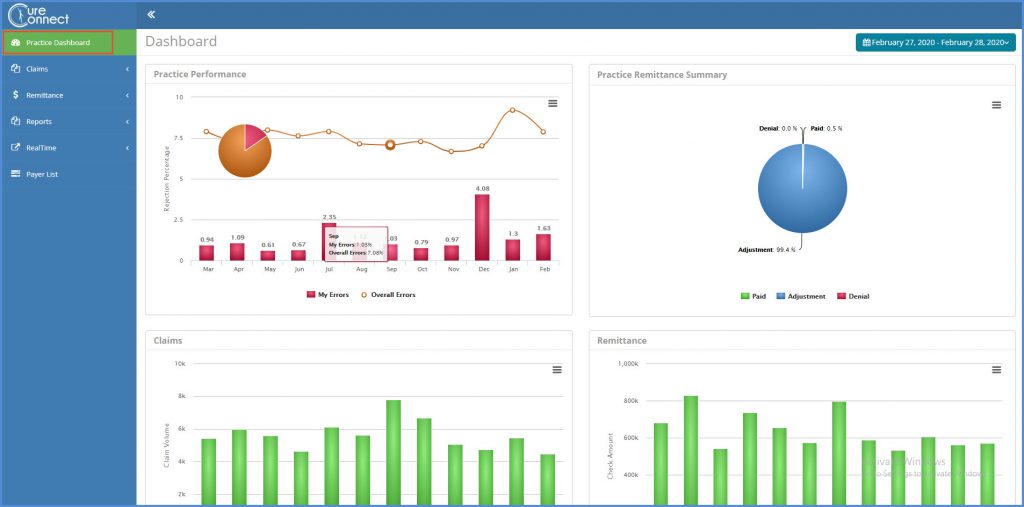
Key Performance Indicators

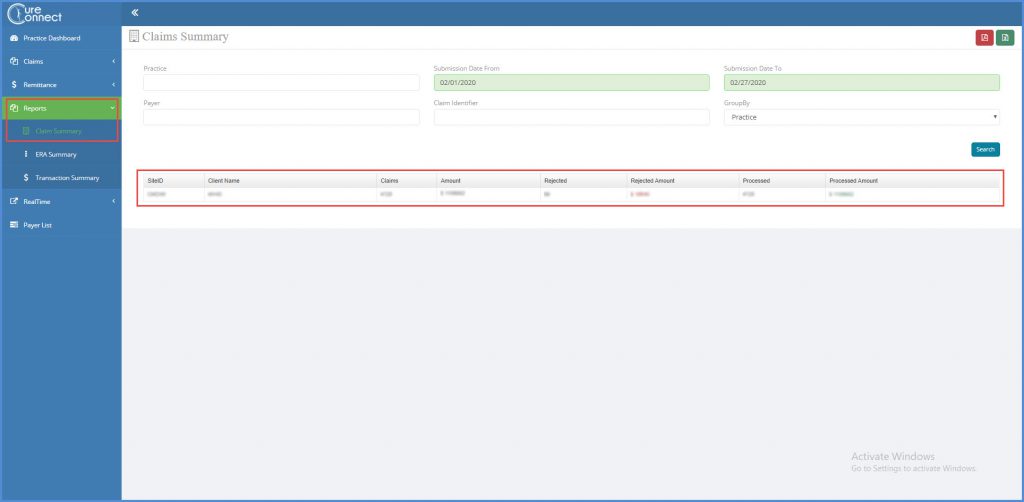
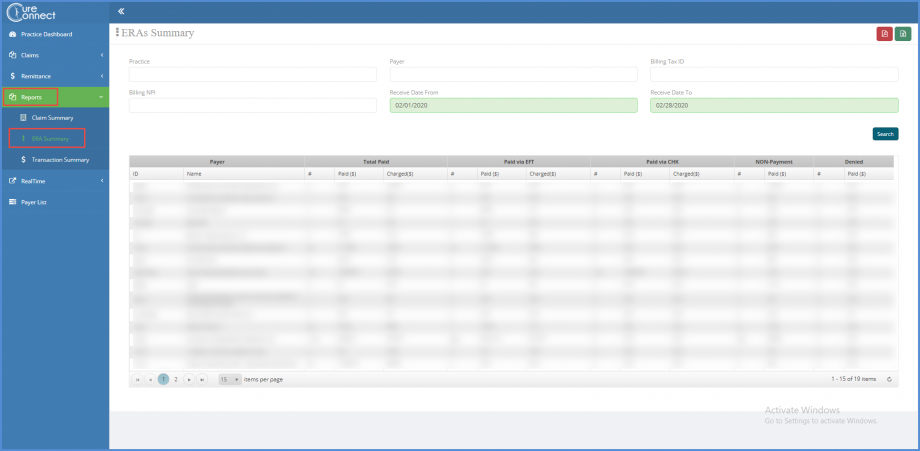
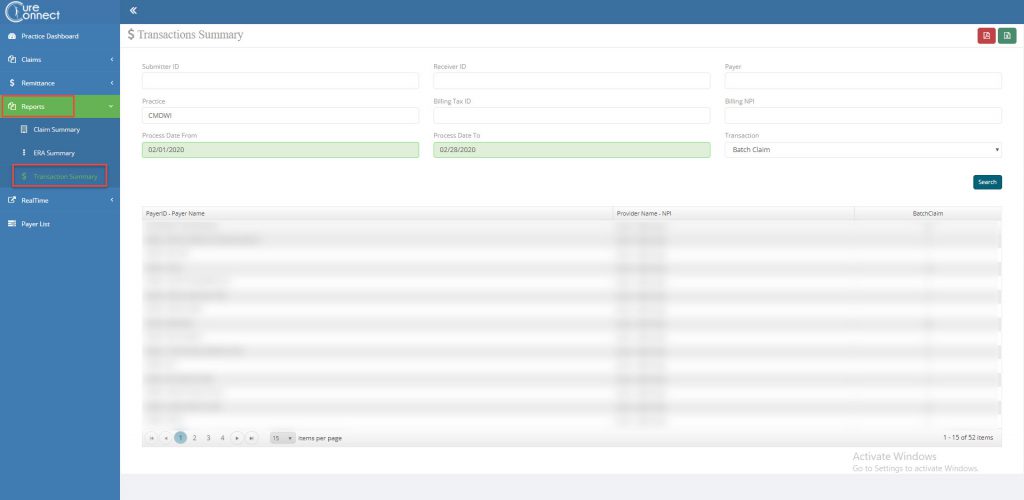
The Reports section contains following report types:
- Claim Summary
- ERA Summary
- Transaction Summary
Claim Summary’ report:
ERA Summary:
Transaction Summary’ report:
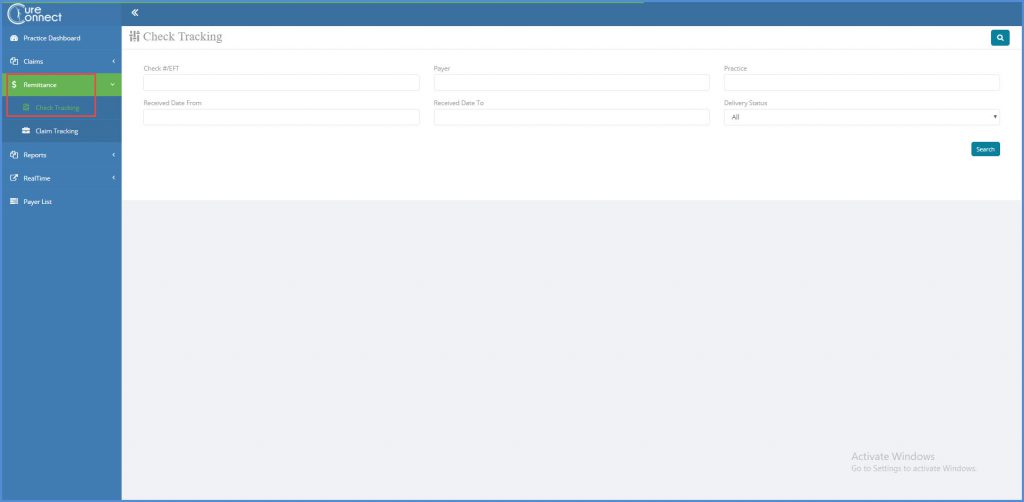
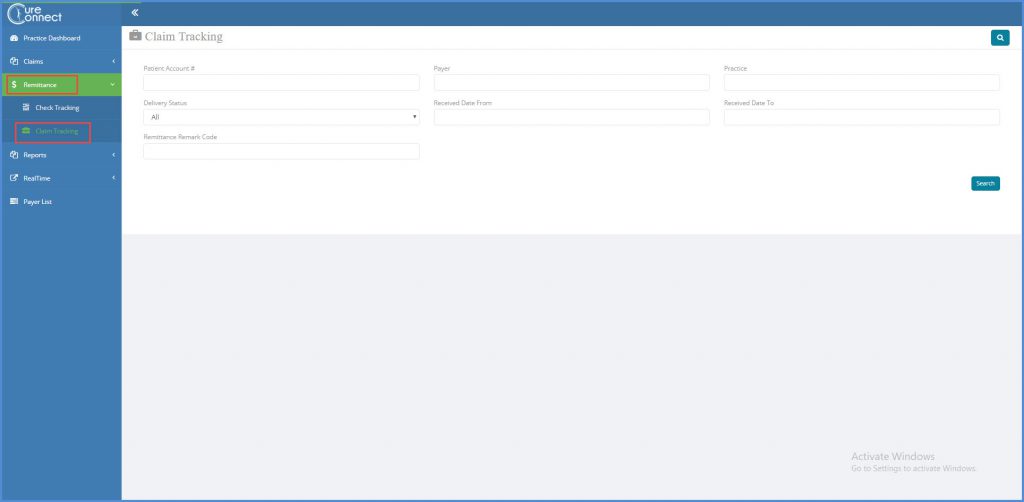
You can also track your ‘Claims’ and ‘Checks’ from the ‘Remittances’ section.