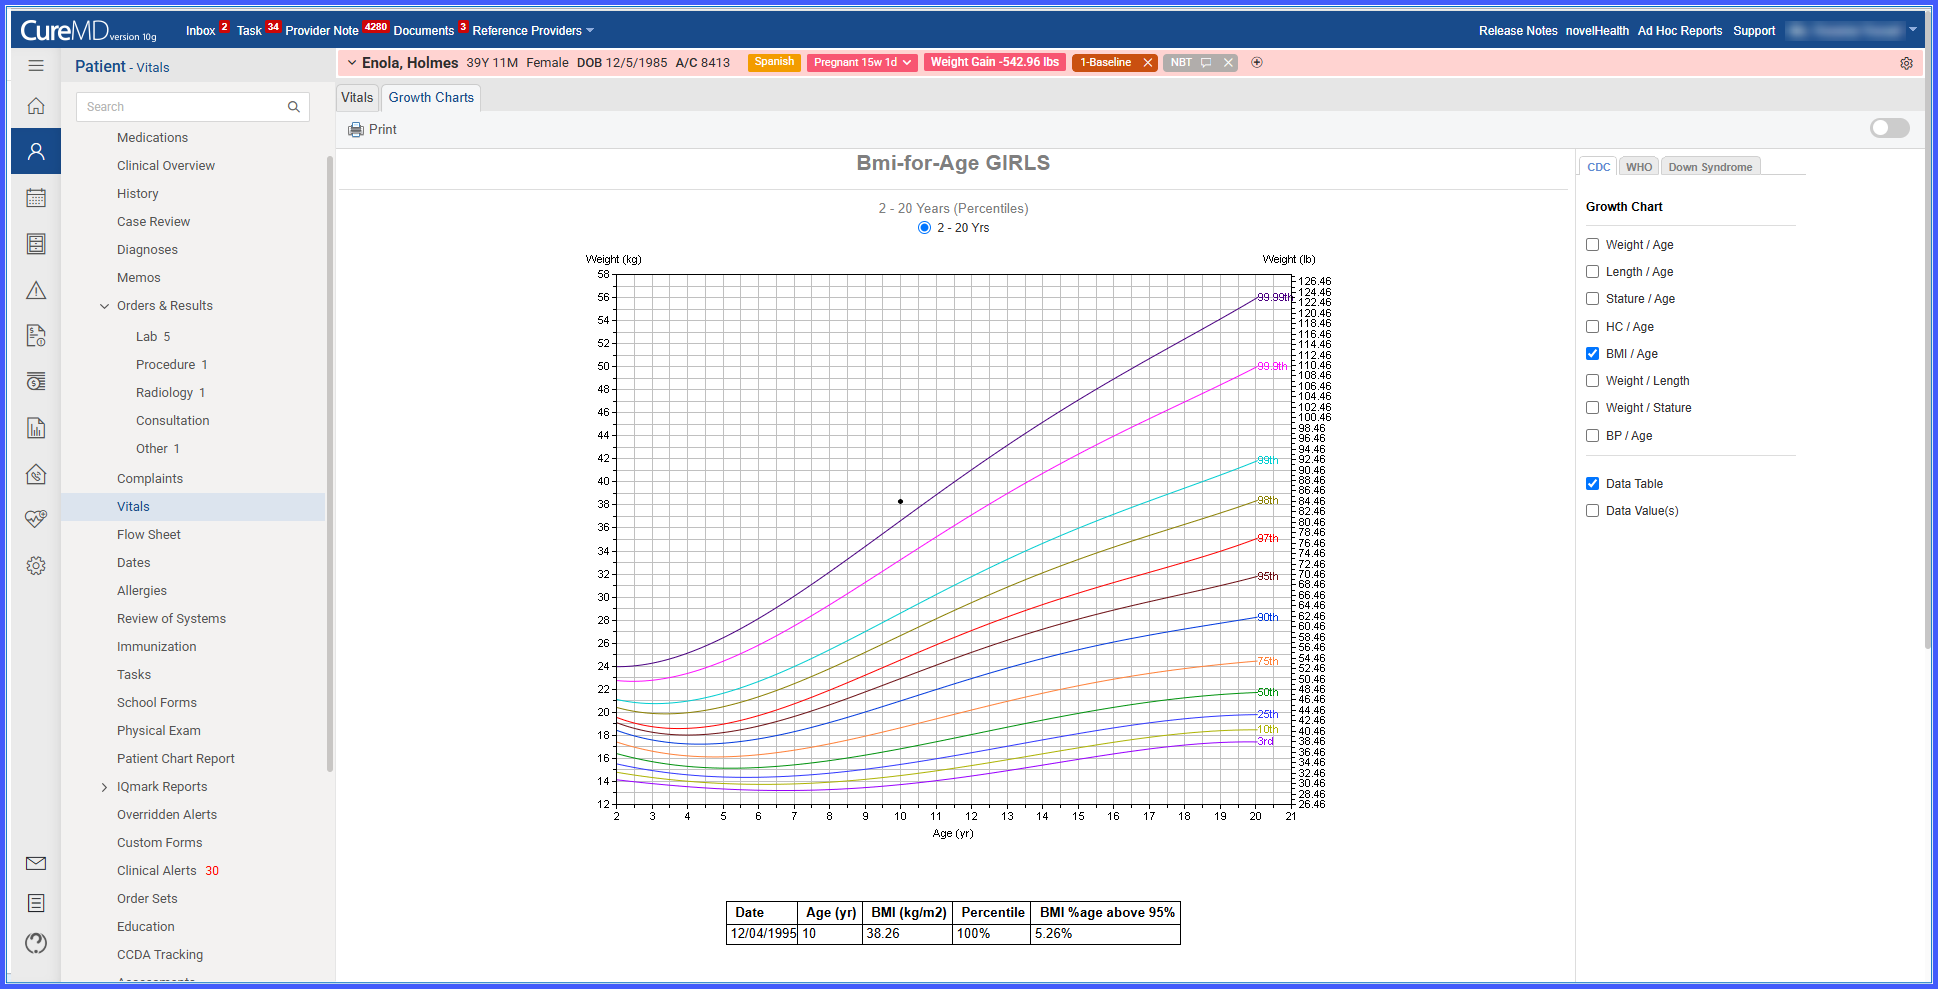
95th Percentile Line and BMI % Above 95 Displayed in BMI Growth Charts
What’s New
- A 95th percentile line is now plotted across the full age range on all BMI growth charts using the standard dark-red 95+ percentile color.
- A new data table column labeled “BMI %age above 95%” displays the calculated BMI percentage relative to the 95th percentile for entries above the 95th percentile threshold.
- The calculation uses the formula: (patient’s BMI / 95th percentile BMI for that age) * 100.
- Rows with BMI at or below the 95th percentile show the column as blank.
How It Works
-
Navigate to: Patient > Clinical > Vitals > Growth Charts.
-
Open any BMI growth chart.
-
The system references the standard percentile dataset and automatically plots a continuous 95th percentile curve in dark red across all ages.
-
The chart updates dynamically based on the selected patient’s BMI data.
-
Open the BMI data table associated with the chart.
-
Review the new “BMI %age above 95%” column, which displays the computed value only for entries above the 95th percentile.
Benefits
-
Improves clarity by making the 95th percentile visually identifiable across the entire chart.
-
Supports more precise clinical interpretation by quantifying how far above the 95th percentile a BMI value is.
-
Reduces manual calculation effort by presenting the percentage directly in the data table.
-
Enhances consistency with existing percentile visualization standards.