What Information is Displayed on Quality Dashboard?
Follow the above mentioned workflow to land on the ‘Overview’ tab.
Select the required entity from the ‘Entity’ dropdown
Click ‘Quality’ tab to display details.
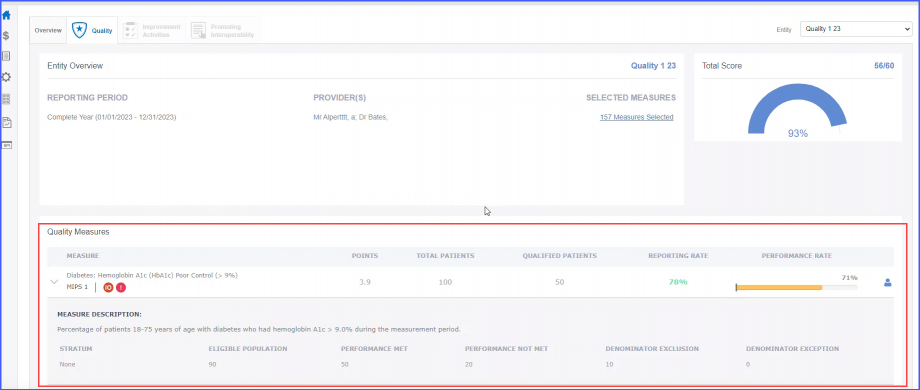
Here, the header displays the following:
- ‘Entity Name’
- ‘Reporting Period’
- ‘Providers’
- Total score of the PI category.
The header remains fixed and can be seen on the ‘Patient List’ screen as well.
On this screen, measures and scores of active entities are displayed.
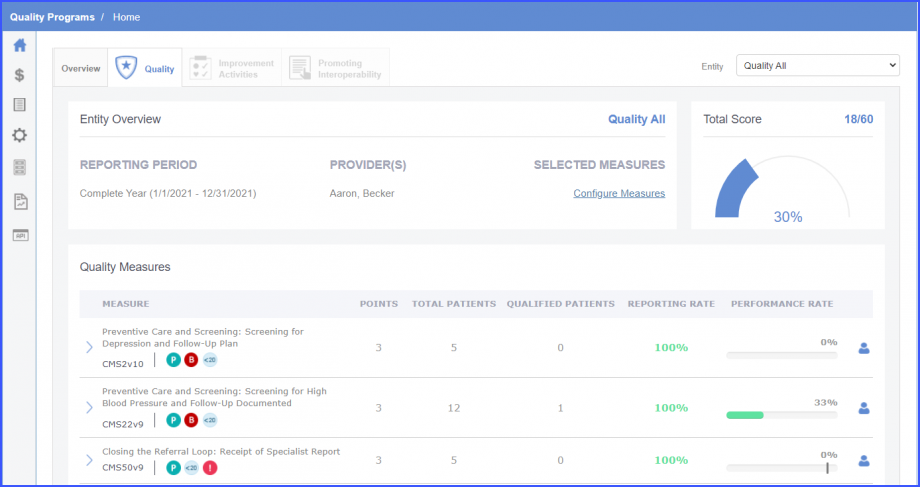
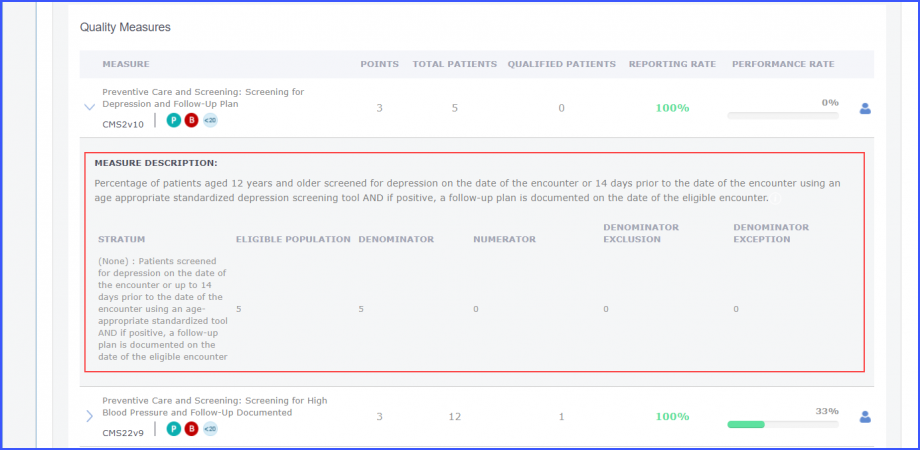
To view the description of each measure, expand the measure by clicking the arrow to the left of the measure ID.
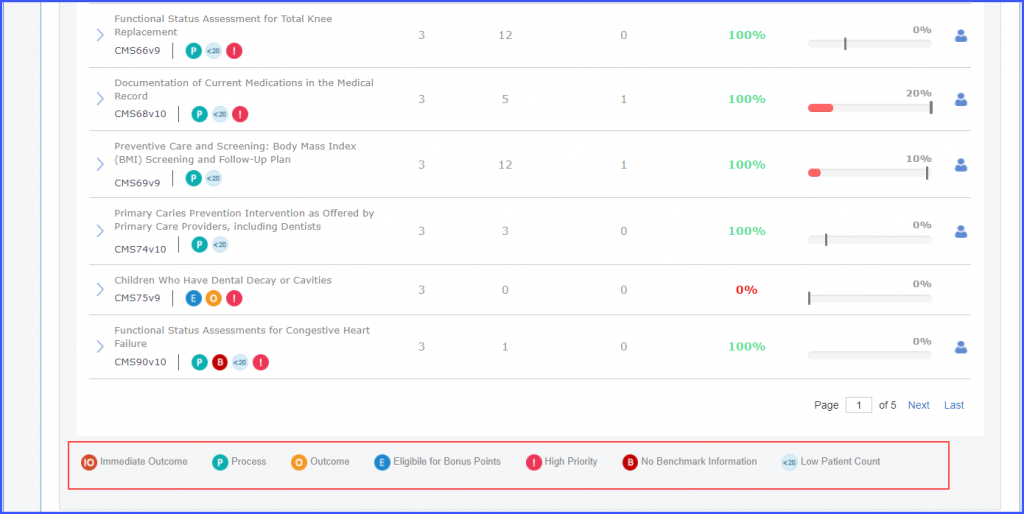
The icons against the measure ID show what kind of measure it is and what information it contains.
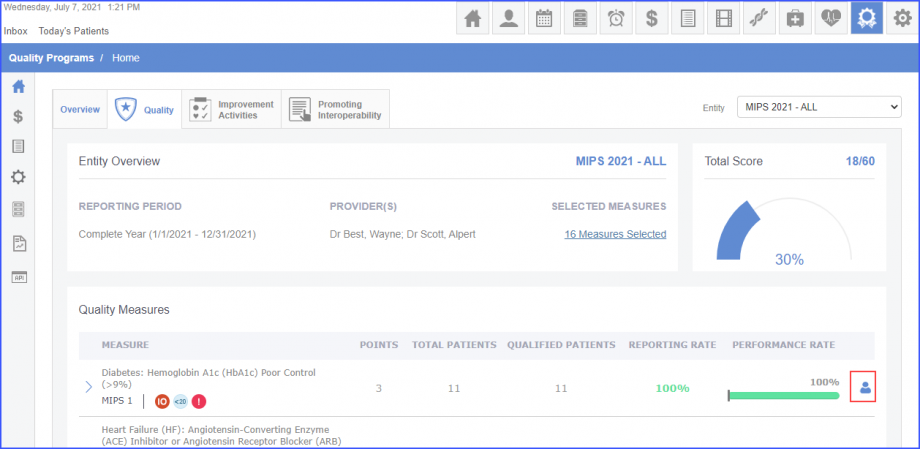
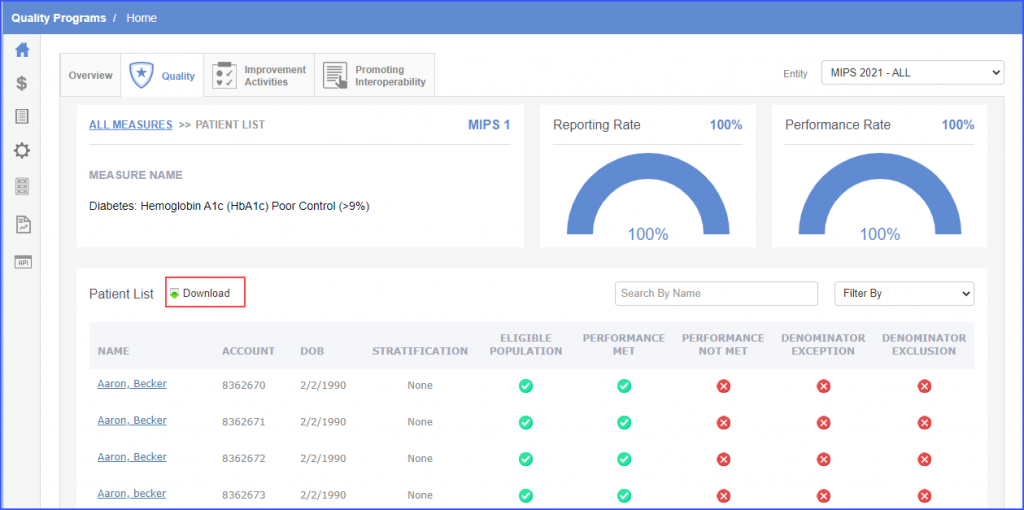
Click the patient icon next to a measure to see a list of patients falling under that measure.
Users have the option to download patient list for the measures in Quality category of MIPS entities.
This helps providers evaluate patient counts and receive incentives from CMS.
Click the patient icon.
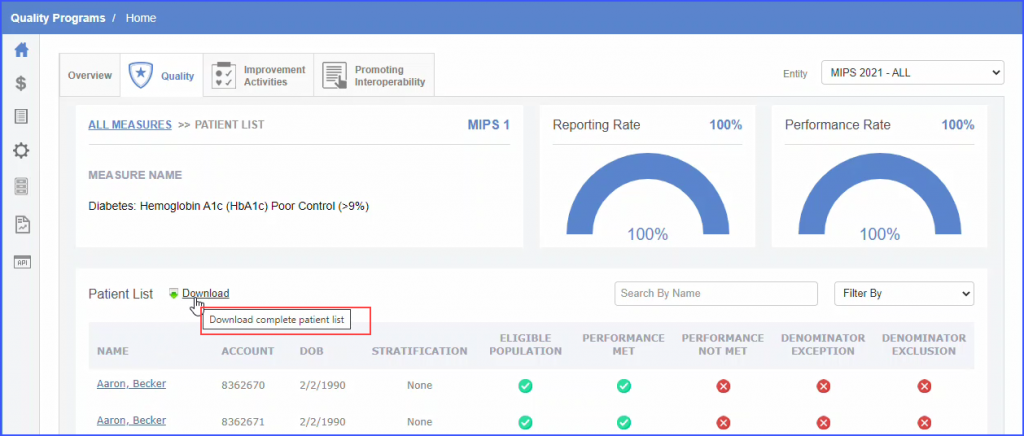
Then click the ‘Download’ hyperlink to download the patient list.
When the user hovers over the ‘Download’ hyperlink the system displays the following tooltip:
‘Download complete patient list’
In order to view details of a patient, click the patient name in the ‘Name’ column.
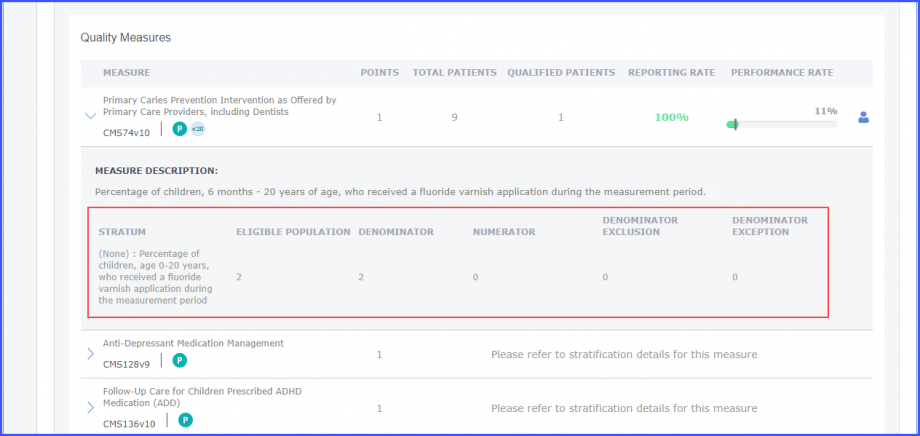
Accurate stratum names and patient counts are displayed for single and multi-population measures.
Select an entity with ‘Performance Year’ 2021 and submission method ‘EHR’.
Expand a measure to view the stratum name(s) and patient count in:
- Eligible Population
- Denominator
- Numerator
- Denominator Exclusion
- Denominator Exception
For multi-population measures, users can view the patient count details for each stratum.
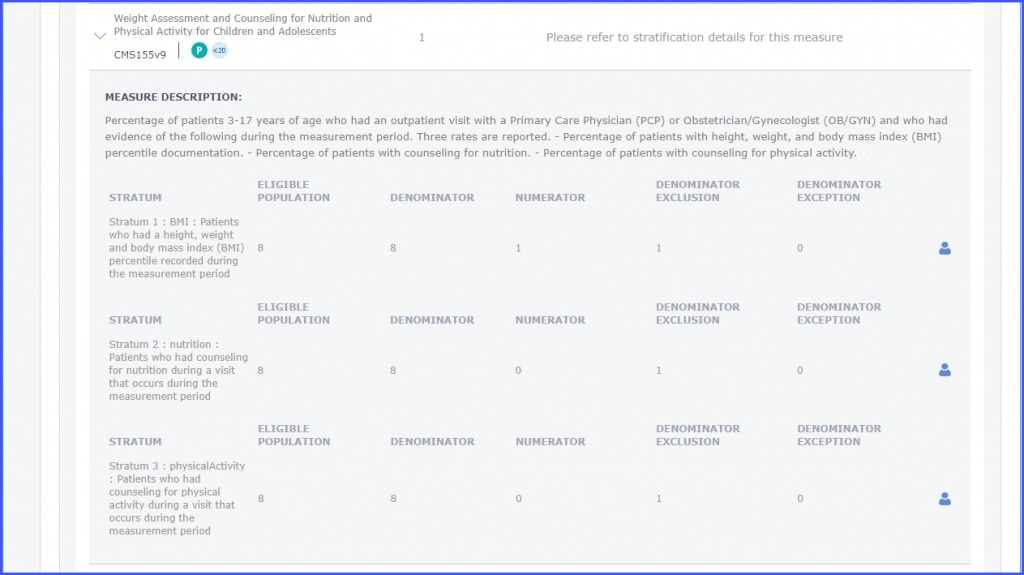
A patient icon is displayed next to each stratum. Click the patient icon to view the patient list specific to a stratum. On the ‘Patient List’ screen, the ‘Stratum Name’, ‘Reporting Rate’, and ‘Performance Rate’ are also displayed.
Users can download the patient list for a stratum by clicking the ‘Download hyperlink.
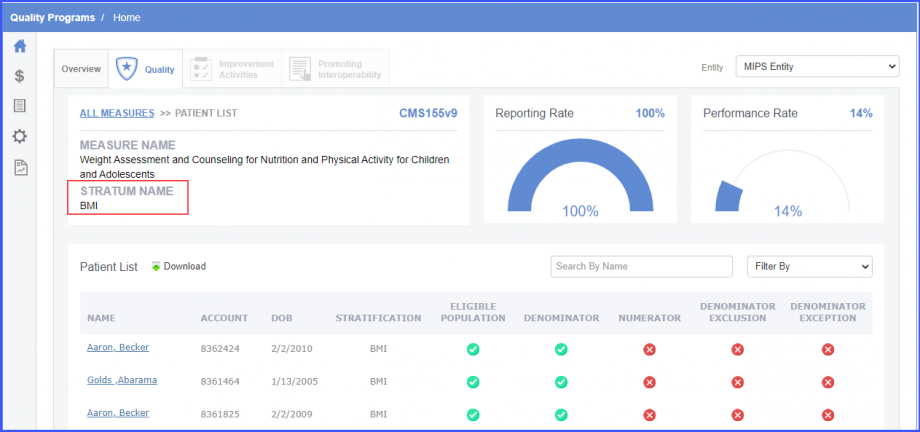
The downloaded patient list has ‘Date of Service’ and ‘Provider Name’ columns.
This helps providers improve performance and receive incentives from CMS.
Similar enhancement has been made in the ‘Promoting Interoperability’ category. Click here, to see the change.
The user can view their Practices’ ranking against PI and Quality Measures.
This ensures feedback on the ranking details.
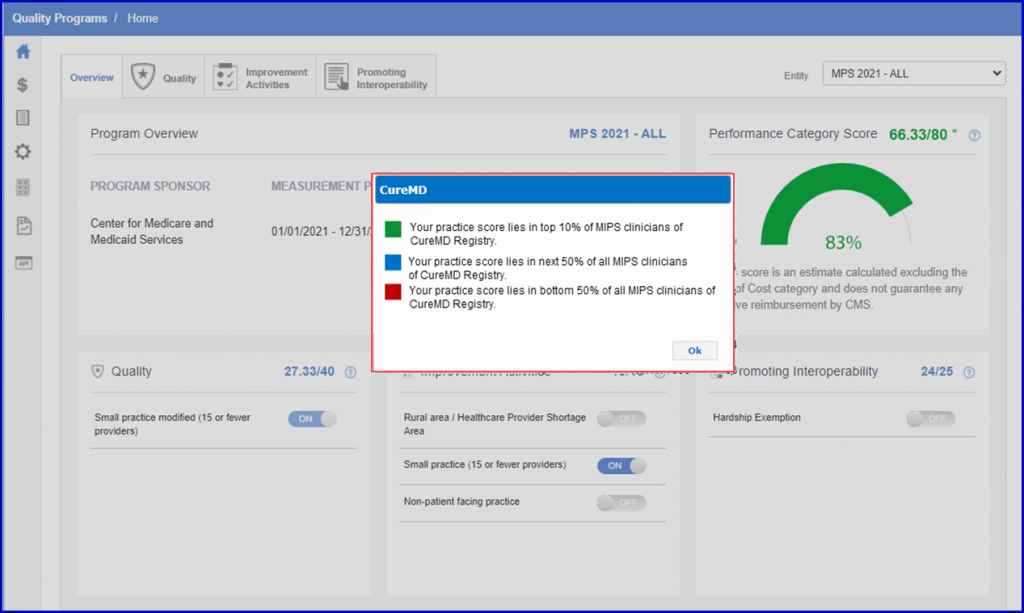
The system shall compare the CureMD MIPS clinician’s total MIPS scores to other CureMD MIPS clinicians (other practices).
The system displays color-code the total score, total score progress bar, and total score percentage.
Green Indicates the top 10% of all MIPS clinicians.
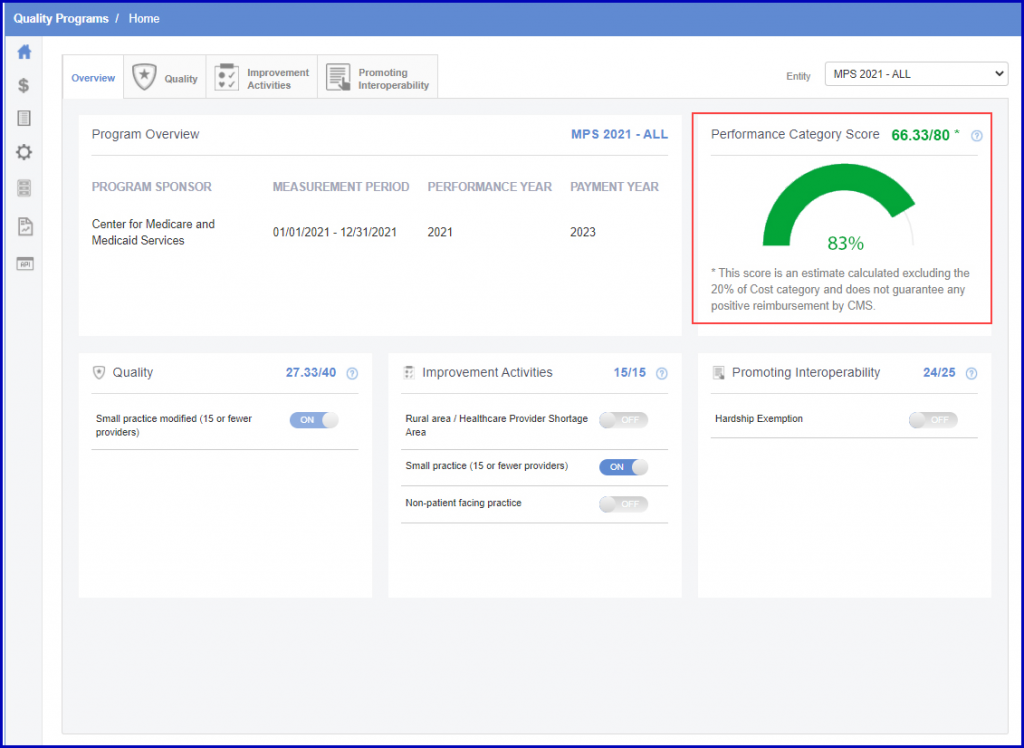
Blue indicates 50% of all MIPS clinicians excluding the top 10.
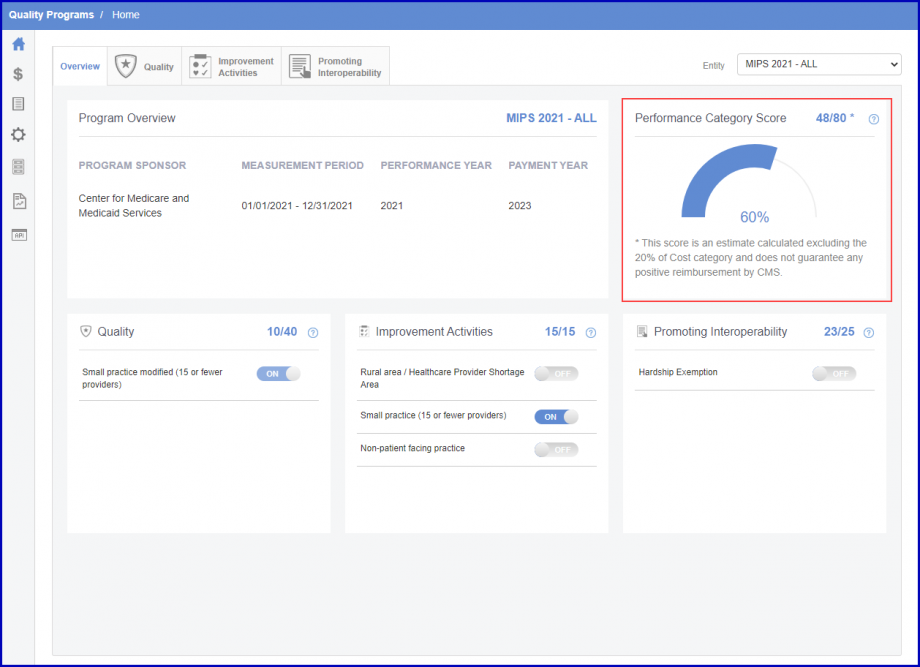
Red indicates the bottom 50% of all CureMD MIPS clinicians.
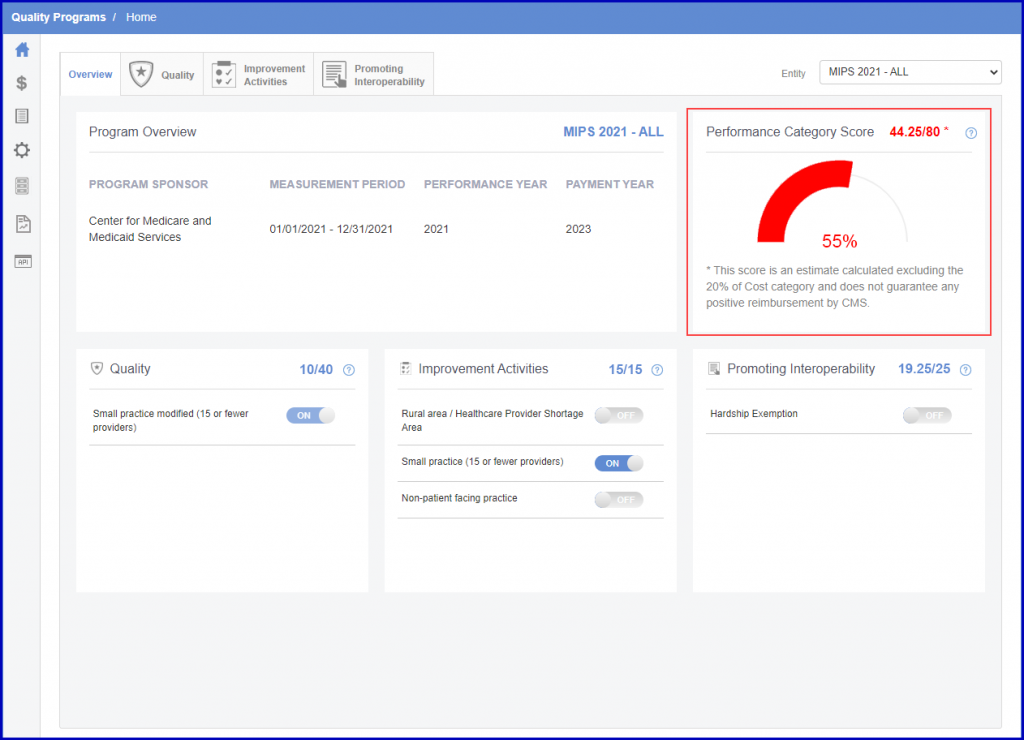
Clicking on the score hyperlink opens a popup that acts as a key explaining the color-coded ranks.
A similar enhancement has been made in the ‘Promoting Interoperability’ section. Click here to see the change.
MIPS quality benchmarks for 2023 are displayed on the quality dashboard.
This allows users to review MIPS score and make necessary adjustments for effective reporting.
Changes made to the patient’s qualification in MIPS CQMs from the patient chart are displayed on the MIPS Dashboard as well.![]()
