How to Access Dashboard?
On the application banner, click on the ‘Chronic Care Management’ (CCM) icon to land on the ‘CCM’ dashboard.

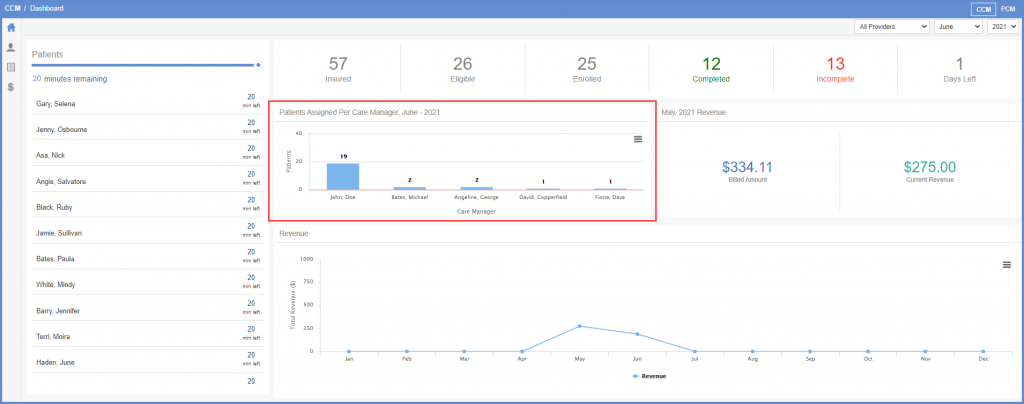
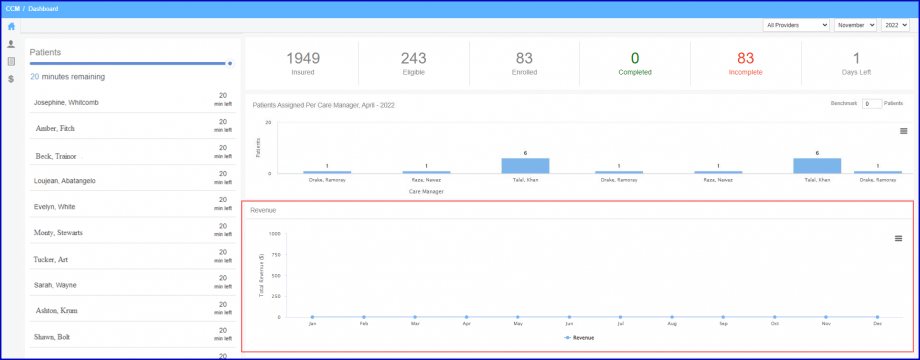
The Dashboard displays a list of all the enrolled patients along with the time left in completing their CCM services. It also displays the categories and the number of patients that exists in these categories.
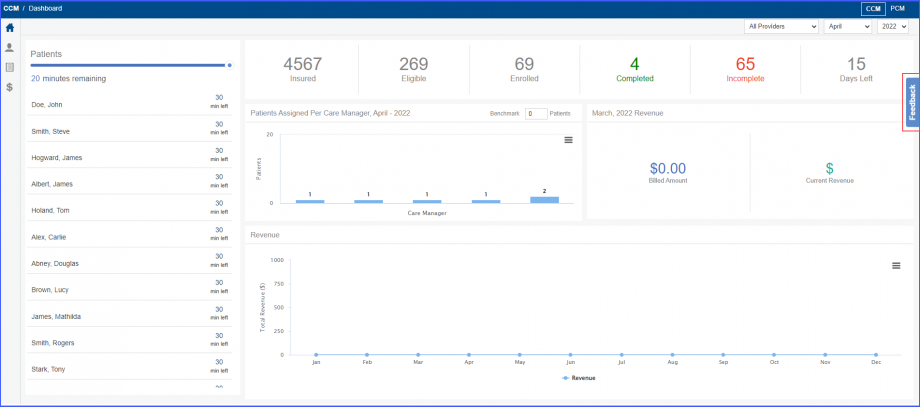
“Insured” shows the total count of patients registered with the insurance.
“Eligible” shows the total count of patients who are eligible for CCM services.
“Enrolled” shows the patient count that has acquired CCM services.
“Completed” displays the patient count whose CCM services for current calendar month are complete i.e. equal to or more than 20 minutes of non-face to face visits.
“Incomplete” category is for patients whose CCM services for current calendar month are incomplete i.e. less than 20 minutes of non-face to face visits.
“Days Left” is the number of days remaining for this calendar month to complete CCM services of enrolled patients.
Month’s revenue is displayed in numbers and graphically under the Revenue heading.
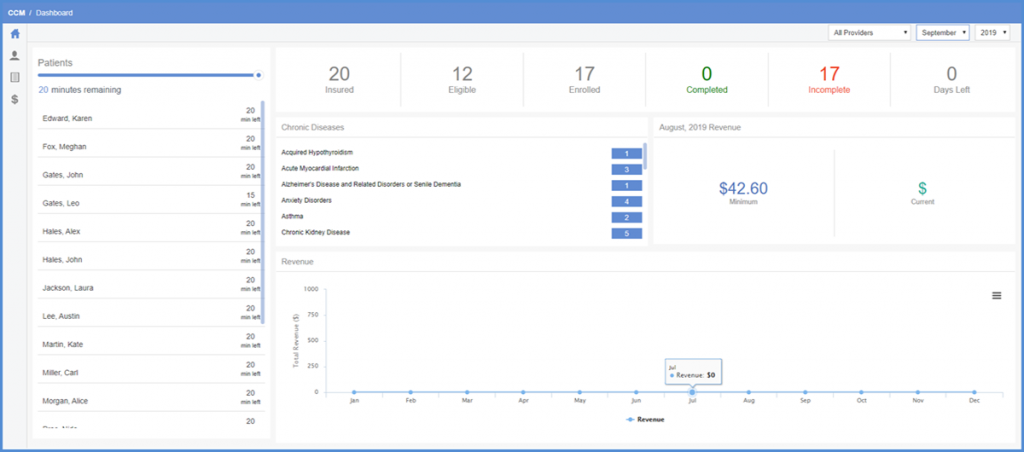
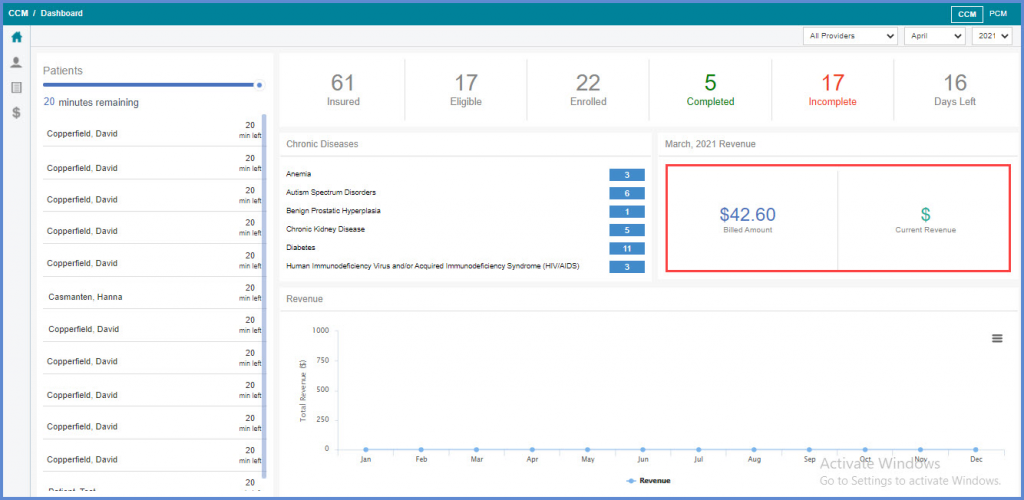
Under ‘Chronic Diseases’ heading, list of diseases with number of enrolled patients is shown.
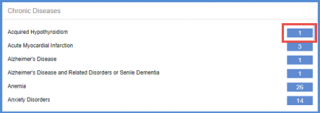
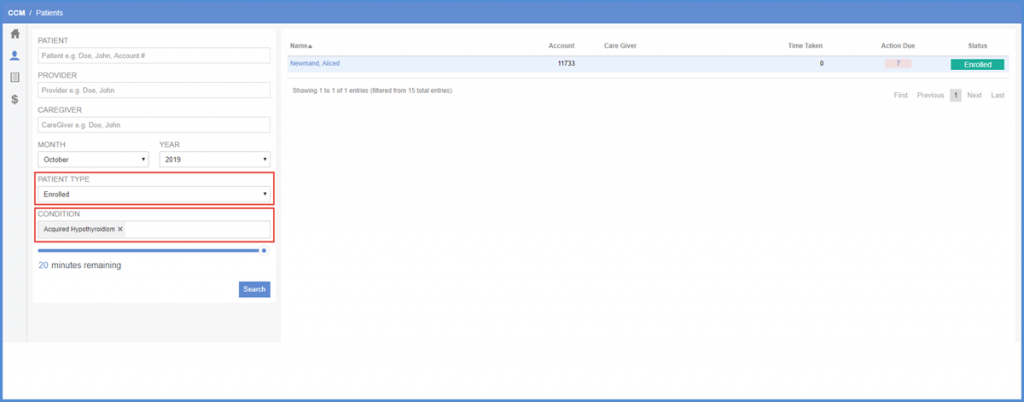
Clicking number hyperlink navigates to the list of patients with that disease in the patient column.
Revenue heading displays yearly revenue in graphical format. User can hover over any month to see that specific month’s revenue total.
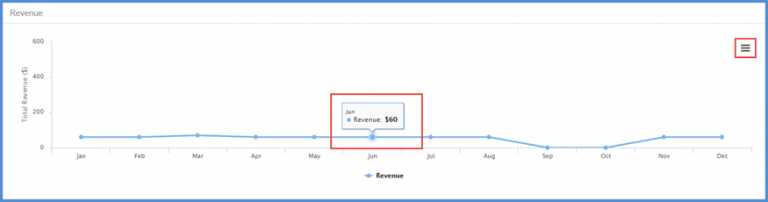
Click ‘Menu’ icon to print this chart or download image in ‘PNG’, ‘JPEG’, ‘SVG Vector’ formats.
This can also be downloaded in form of a PDF document.
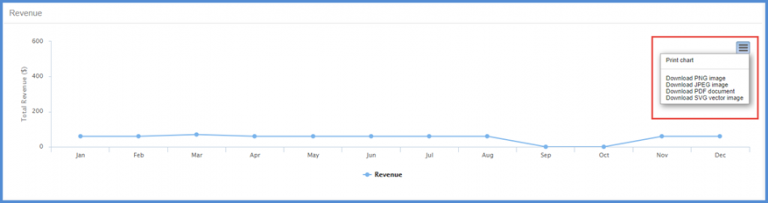
- Print Chart
- Download PNG Image
- Download JPEG Image
- Download PDF Document
- Download SVG vector image
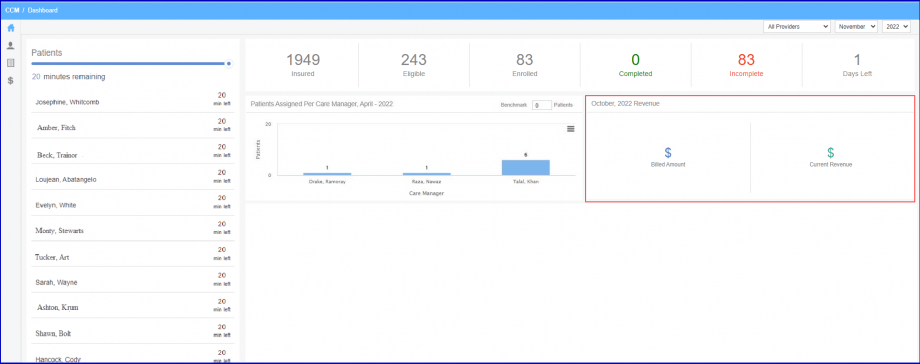
The ‘Billed Amount’ KPI displays the total amount in dollars that CCM patients have been billed for in the previous month. The ‘Current Revenue’ displays the total payments that the practice has received for these bills in the previous month.
By default, the monthly and yearly revenue information is displayed on the CCM dashboard for all the users. Click here to view how to enable user permissions for the CCM dashboard.![]()
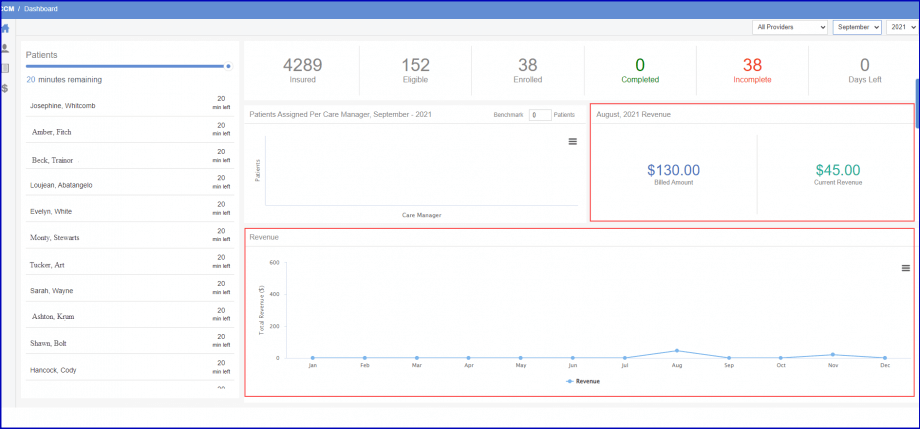
To restrict a user from viewing monthly revenue, disable monthly revenue permission from ‘Role’ and ‘Practice User’ components of the ‘Settings’ module and click ‘Save’. This leads to the monthly revenue information not being displayed on the CCM dashboard. Only the yearly revenue information is displayed.
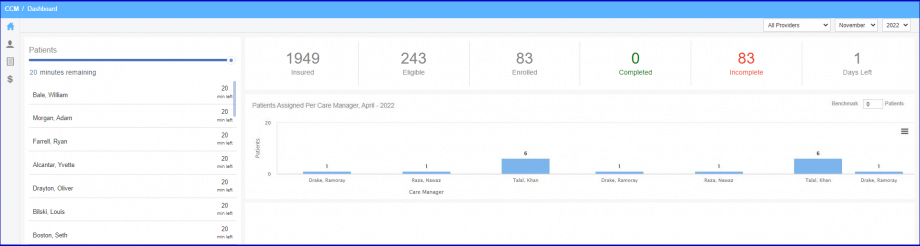
Similarly, to restrict a user from viewing yearly revenue, disable yearly revenue permission from ‘Role’ and ‘Practice User’ components of the ‘Settings’ module and click ‘Save’. This leads to the yearly revenue information not being displayed on the CCM dashboard. Only the monthly revenue information is displayed.
When both monthly and yearly revenue are disabled from the settings, then both are not displayed on the CCM dashboard.
Similar enhancement has been made in the ‘PCM’ section. Click here, to view the change.
Users can provide feedback about their experience on MIPS, CCM and PCM pages.
This helps CureMD identify problem areas and make user-oriented decisions.
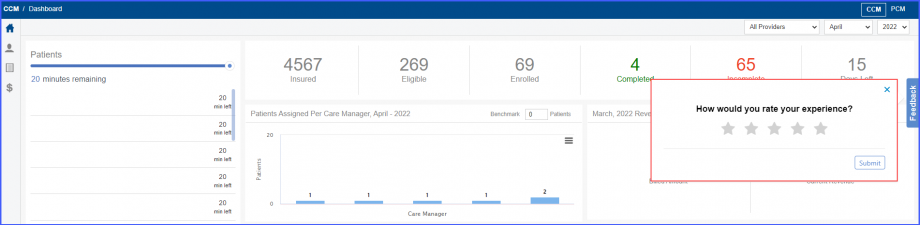
To provide feedback, click on the ‘Feedback’ button.
Once the ‘Feedback’ button is clicked, a feedback overlay is displayed. Users can rate their experience by clicking on the desired star.
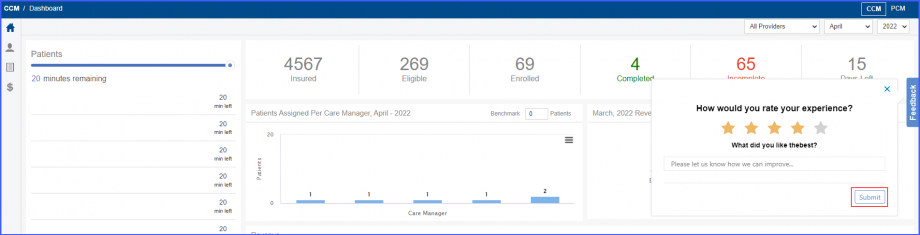
After a star is clicked, further feedback options appear. Click ‘Submit’ to submit the feedback.
Similar enhancement has been made in the ‘PCM’ section. Click here, to view the change.
