How to View Graph for Blood Pressure Percentile?
Users can view changes in a patient’s Blood Pressure percentile over a certain period of time in graphical form.
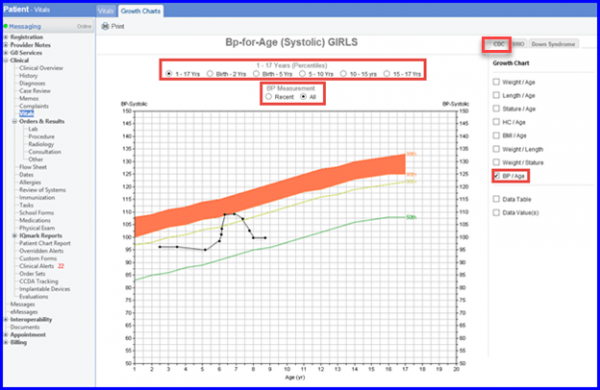
Follow the workflow above to land on the ‘Growth Charts’ screen.
Select the CDC tab and enable the BP/Age checkbox in the ‘Growth Chart’ section.
Blood Pressure View
Users can use the age and ‘BP Measurement’ radio buttons to view single and multiple graph plots for blood pressure percentile.
Users can also view the graph plots by age divisions from birth to 17 years of age.
