How to View MIPS Quality?
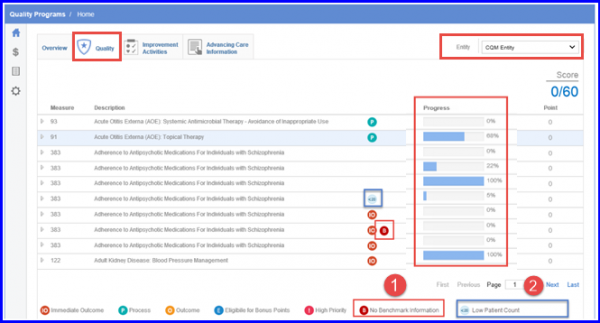
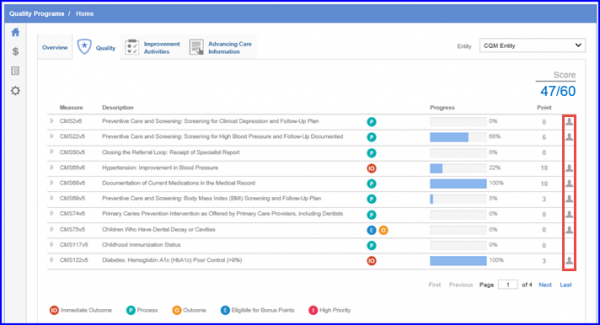
On the Home page, select Quality tab to view the measures of an entity under this category and the progress of the entity against each measure.
Select an entity from the dropdown on top-right corner. The page will display the following details:
-
- Measure: User can view the Measure along with its description
- Points: These points indicate the projected score gained against each measure.
- Progress: The progress bar displays the overall progress of an individual measure in percentage.
- Score: This score indicates overall score of the measures within that category.
- Icons: Quality measures under MIPS have been sub-categorized into Efficiency, Intermediate Outcome, Outcome, Patient Engagement/Experience, Process and Structure measures. The measure types can be identified by icons. To clearly distinguish between these measures; CureMD has introduced symbols for measures with no benchmark information with the following icons:
1. Benchmark Information: Measures with no benchmark information are represented with this icon.
2. Low Patient Count: For measures that haven’t met the case minimum requirement of denominator population are denoted with this icon
 - Legend: User can refer to the legend for more information.
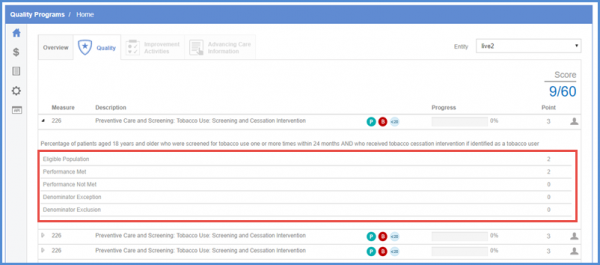
The user can also click on the expand arrow against a measure to view further details of that measure.
In ‘Measure’, quality data is classified according to the MIPS format.
Quality data is classified as:
- Eligible Population
- Performance Met
- Performance Not Met
- Exclusion
- Exception
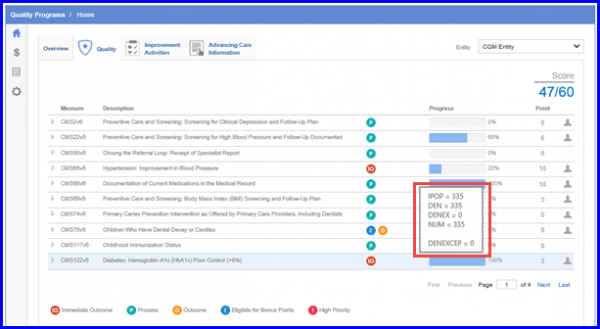
Hovering the cursor on a progress bar shows a tool-tip containing details of that progress.
The user can click on patient icon against any measure to view the list of patients associated with that measure.
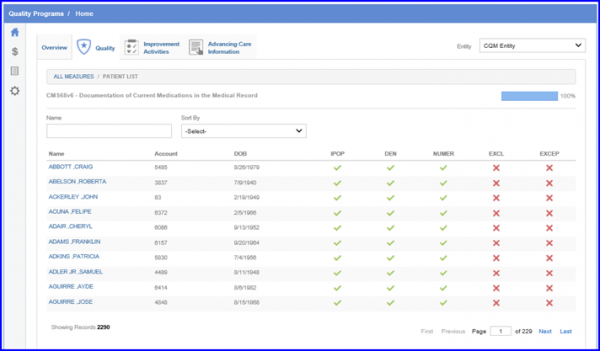
Values in the ‘Sort By’ dropdown are also classified similarly. Moreover, only the data for which the selected change has been triggered is shown.
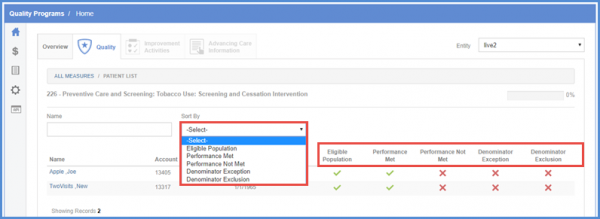
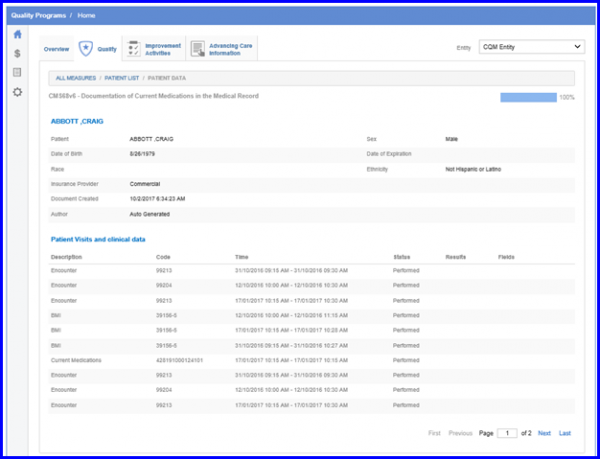
The user can view a patient’s profile, patient visits and clinical data by clicking on your desired patient’s name from the list.
